Walmart 2011 Annual Report Download - page 2
Download and view the complete annual report
Please find page 2 of the 2011 Walmart annual report below. You can navigate through the pages in the report by either clicking on the pages listed below, or by using the keyword search tool below to find specific information within the annual report.-
 1
1 -
 2
2 -
 3
3 -
 4
4 -
 5
5 -
 6
6 -
 7
7 -
 8
8 -
 9
9 -
 10
10 -
 11
11 -
 12
12 -
 13
13 -
14
-
15
-
16
-
17
-
18
-
19
-
20
-
21
-
22
-
23
-
24
-
25
-
26
-
27
-
28
-
29
-
30
-
31
-
32
-
33
-
34
-
35
-
36
-
37
-
38
-
39
-
40
-
41
-
42
-
43
-
44
-
45
-
46
-
47
-
48
-
49
-
50
-
51
-
52
-
53
-
54
-
55
-
56
-
57
-
58
-
59
-
60
-
61
-
62
 |
 |

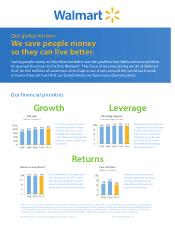
Our global mission
We save people money
so they can live better.
Saving people money to help them live better was the goal that Sam Walton envisioned when
he opened the doors to the rst Walmart®. This focus drives everything we do at Walmart.
And, for the millions of customers who shop in our stores around the world each week,
it means they can trust that our brand means we have every day low prices.
Growth
Net sales
(dollars in billions)
Return on investment1
Our financial priorities
In FY12, we expect to grow
net sales between 4% and
6% through new square
footage and comparable
sales. Walmart International
remains a major contributor
to growth.
Our commitment is to keep return
on investment, or ROI, stable.
One of our priorities is returning
value to shareholders through
dividends and share repurchases.
Leverage
Operating expense
(as a percentage of sales)
The productivity loop now
is ingrained in our business
model. Every day low cost
(EDLC) drives our ability
to deliver every day low
price (EDLP). We remain
committed to leveraging
operating expenses.
Free cash ow1
(dollars in billions)
Walmart continues to invest
capital to grow the business,
and our operating results
helped to produce another
year of strong returns.
(1)
Return on investment (ROI) and free cash flow are non-GAAP measures. Return on assets (ROA) is the closest GAAP measure to ROI and net cash provided by
operating activities of continuing operations is the closest GAAP measure to free cash flow. The reconciliations and other information regarding ROI and free
cash flow and their closest GAAP measures can be found in the Management’s Discussion and Analysis of Financial Condition and Results of Operations
included in this Annual Report. A reconciliation of ROI to ROA for fiscal 2009 is reflected on our website at www.walmartstores.com/investors.
All trademarks in this report are the property of their respective owners. © 2011 Wal-Mart Stores, Inc.
Returns
0
5
15
$20
10
10.9
FY11
14.1
FY10
11. 6
FY09
0
100
300
400
$500
200
FY11
419
405
FY10
401
FY09
374
FY08
345
FY07
0
20%
15
10
5
FY11
19.3
19.7
FY10
19.3
FY09
19.0
FY08
18.5
FY07
0
5
15
20%
10
19.2
FY11
19.3
FY10
19.3
FY09