Walmart 2011 Annual Report Download - page 29
Download and view the complete annual report
Please find page 29 of the 2011 Walmart annual report below. You can navigate through the pages in the report by either clicking on the pages listed below, or by using the keyword search tool below to find specific information within the annual report.-
 1
1 -
2
-
3
-
4
-
5
-
6
-
7
-
8
-
9
-
10
-
11
-
12
-
13
-
14
-
15
-
16
-
17
-
18
-
 19
19 -
 20
20 -
 21
21 -
 22
22 -
 23
23 -
 24
24 -
 25
25 -
 26
26 -
 27
27 -
 28
28 -
 29
29 -
 30
30 -
 31
31 -
 32
32 -
 33
33 -
 34
34 -
 35
35 -
 36
36 -
 37
37 -
 38
38 -
 39
39 -
40
-
41
-
42
-
43
-
44
-
45
-
46
-
47
-
48
-
49
-
50
-
51
-
52
-
53
-
54
-
55
-
56
-
57
-
58
-
59
-
60
-
61
-
62
 |
 |

Management’s Discussion and Analysis of Financial
Condition and Results of Operations
Walmart 2011 Annual Report 27
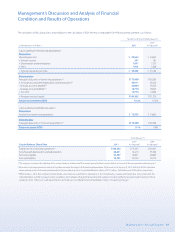
As of January 31, 2011, our variable rate borrowings, including the eect
of our interest rate swaps, represented 15% of our total short-term and
long-term debt. Based on January 31, 2011 debt levels, a 100 basis point
change in prevailing market rates would cause our annual interest costs
to change by approximately $59 million.
Foreign Currency Risk
We hold currency swaps to hedge the currency exchange component of
our net investments in the United Kingdom. In scal 2010, we entered into
currency swaps to hedge the currency exchange rate uctuation exposure
associated with the forecasted payments of principal and interest of
non-U.S. denominated debt. The aggregate fair value of these swaps at
January 31, 2011 and 2010 represented a gain of $471 million and $475 million,
respectively. A hypothetical 10% increase or decrease in the currency
exchange rates underlying these swaps from the market rate would have
resulted in a loss or gain in the value of the swaps of $74 million and
$58 million at January 31, 2011 and 2010, respectively. A hypothetical 10%
change in interest rates underlying these swaps from the market rates in
eect at January 31, 2011 would have resulted in a loss or gain in value of
the swaps of $7 million on the value of the swaps.
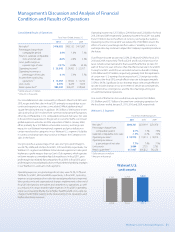
In addition to currency swaps, we have designated debt of approximately
£3.0 billion as of January 31, 2011 and 2010, as a hedge of our net investment
in the United Kingdom. At January 31, 2011 and 2010, a hypothetical 10%
increase or decrease in value of the U.S. dollar relative to the British pound
would have resulted in a gain or loss, respectively, in the value of the debt
of $480 million. In addition, we have designated debt of approximately
¥437.0 billion as of January 31, 2011 and 2010 as a hedge of our net invest-
ment in Japan. At January 31, 2011, a hypothetical 10% increase or decrease
in value of the U.S. dollar relative to the Japanese yen would have resulted
in a gain or loss in the value of the debt of $533 million. At January 31, 2010,
a hypothetical 10% increase or decrease in value of the U.S. dollar relative
to the Japanese yen would have resulted in a gain or loss in the value of
the debt of $485 million.
Summary of Critical Accounting Policies
Management strives to report the nancial results of the Company in a
clear and understandable manner, although in some cases accounting
and disclosure rules are complex and require us to use technical termi-
nology. In preparing our consolidated nancial statements, we follow
accounting principles generally accepted in the United States. These
principles require us to make certain estimates and apply judgments that
aect our nancial position and results of operations as reected in our
nancial statements. These judgments and estimates are based on past
events and expectations of future outcomes. Actual results may dier
from our estimates.
Management continually reviews the Company’s accounting policies,
how they are applied and how they are reported and disclosed in our
nancial statements. Following is a summary of our more signicant
accounting policies and how they are applied in preparation of the
nancial statements.
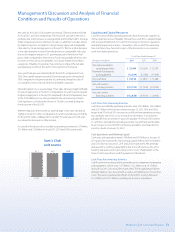
Inventories
The Company values inventories at the lower of cost or market as determined
primarily by the retail method of accounting, using the last-in, rst-out
(“LIFO”) method for substantially all of the Walmart U.S. segment’s
merchandise inventories. The retail method of accounting results in inventory
being valued at the lower of cost or market since permanent markdowns
are currently taken as a reduction of the retail value of inventory. The Sam’s
Club segment’s merchandise is valued based on the weighted-average
cost using the LIFO method. Inventories for the Walmart International
operations are primarily valued by the retail method of accounting and
are stated using the rst-in, rst-out (“FIFO”) method. At January 31, 2011
and 2010, our inventories valued at LIFO approximated those inventories
as if they were valued at FIFO.
Under the retail method, inventory is stated at cost, which is determined
by applying a cost-to-retail ratio to each merchandise grouping’s retail
value. The FIFO cost-to-retail ratio is based on the initial margin of begin-
ning inventory plus the scal year purchase activity. The cost-to-retail
ratio for measuring any LIFO reserves is based on the initial margin of the
scal year purchase activity less the impact of any markdowns. The retail
method requires management to make certain judgments and estimates
that may signicantly impact the ending inventory valuation at cost, as
well as the amount of gross prot recognized. Judgments made include
recording markdowns used to sell through inventory and shrinkage.
When management determines the salability of inventory has diminished,
markdowns for clearance activity and the related cost impact are recorded
at the time the price change decision is made. Factors considered in the
determination of markdowns include current and anticipated demand,
customer preferences and age of merchandise, as well as seasonal and
fashion trends. Changes in weather patterns and customer preferences
related to fashion trends could cause material changes in the amount
and timing of markdowns from year to year.
When necessary, the Company records a LIFO provision for a quarter for
the estimated annual eect of ination, and these estimates are adjusted
to actual results determined at year-end. Our LIFO provision is calculated
based on inventory levels, markup rates and internally generated retail
price indices. At January 31, 2011 and 2010, our inventories valued at LIFO
approximated those inventories as if they were valued at FIFO.
The Company provides for estimated inventory losses (“shrinkage”)
between physical inventory counts on the basis of a percentage of sales.
The provision is adjusted annually based on historical results to reect
the estimated trend of the actual physical inventory count results.
As discussed in Note 2, eective May 1, 2010, the Company changed the
level at which it applies the retail method for valuing its inventory for its
operations in the United States, Canada and Puerto Rico. The retrospec-
tive application of this accounting change impacted both segment and
consolidated operating income, as well as consolidated net income for
all comparable periods presented.
Impairment of Assets
We evaluate long-lived assets other than goodwill and assets with
indenite lives for indicators of impairment whenever events or changes
in circumstances indicate their carrying amounts may not be recoverable.
Management’s judgments regarding the existence of impairment indicators
are based on market conditions and operational performance, such as
operating income and cash ows. The evaluation for long-lived assets is
performed at the lowest level of identiable cash ows, which is generally
at the individual store level or, in certain circumstances, at the market
group level. The variability of these factors depends on a number of
conditions, including uncertainty about future events and changes in
demographics. Thus, our accounting estimates may change from period
to period. These factors could cause management to conclude that