Walmart 2011 Annual Report Download - page 21
Download and view the complete annual report
Please find page 21 of the 2011 Walmart annual report below. You can navigate through the pages in the report by either clicking on the pages listed below, or by using the keyword search tool below to find specific information within the annual report.-
 1
1 -
2
-
3
-
4
-
5
-
6
-
7
-
8
-
9
-
10
-
 11
11 -
 12
12 -
 13
13 -
 14
14 -
 15
15 -
 16
16 -
 17
17 -
 18
18 -
 19
19 -
 20
20 -
 21
21 -
 22
22 -
 23
23 -
 24
24 -
 25
25 -
 26
26 -
 27
27 -
 28
28 -
 29
29 -
 30
30 -
 31
31 -
32
-
33
-
34
-
35
-
36
-
37
-
38
-
39
-
40
-
41
-
42
-
43
-
44
-
45
-
46
-
47
-
48
-
49
-
50
-
51
-
52
-
53
-
54
-
55
-
56
-
57
-
58
-
59
-
60
-
61
-
62
 |
 |

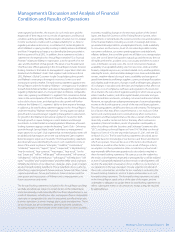
Management’s Discussion and Analysis of Financial
Condition and Results of Operations
Walmart 2011 Annual Report 19
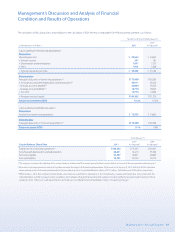
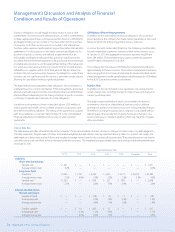
The calculation of ROI, along with a reconciliation to the calculation of ROA, the most comparable GAAP nancial measurement, is as follows:
For the Fiscal Years Ended January 31,
2010
(Dollar amounts in millions)
2011 As Adjusted
(3)
CALCULATION OF RETURN ON INVESTMENT
Numerator
Operating income $ 25,542 $ 24,002
+ Interest income 201 181
+ Depreciation and amortization 7,641 7,157
+ Rent 1,972 1,808
= Adjusted operating income $ 35,356 $ 33,148
Denominator
Average total assets of continuing operations
(1)
$175,400 $166,584
+ Average accumulated depreciation and amortization
(1)
43,911 38,359
- Average accounts payable
(1)
32,004 29,650
- Average accrued liabilities
(1)
18,718 18,423
+ Rent x 8 15,776 14,464
= Average invested capital $184,365 $171,334
Return on investment (ROI) 19.2% 19.3%
CALCULATION OF RETURN ON ASSETS
Numerator
Income from continuing operations $ 15,959 $ 14,962
Denominator
Average total assets of continuing operations
(1)
$175,400 $166,584
Return on assets (ROA) 9.1% 9.0%
As of January 31,
2010 2009
Certain Balance Sheet Data 2011 As Adjusted
(3)
As Adjusted
(3)
Total assets of continuing operations
(2)
$180,532 $170,267 $162,901
Accumulated depreciation and amortization 46,611 41,210 35,508
Accounts payable 33,557 30,451 28,849
Accrued liabilities 18,701 18,734 18,112
(1)
The average is based on the addition of the account balance at the end of the current period to the account balance at the end of the prior period and dividing by 2.
(2)
Based on continuing operations only and therefore excludes the impact of discontinued operations. Total assets as of January 31, 2011, 2010 and 2009 in the table
above exclude assets of discontinued operations that are reected in the Consolidated Balance Sheets of $131 million, $140 million and $195 million, respectively.
(3)
Eective May 1, 2010, the Company implemented a new nancial system for its operations in the United States, Canada and Puerto Rico. Concurrent with this
implementation and the increased system capabilities, the Company changed the level at which it applies the retail method of accounting for inventory in these
operations from 13 divisions to 49 departments. See “Notes to Consolidated Financial Statements,” Note 2. “Accounting Change.”