Windstream 2013 Annual Report Download - page 142
Download and view the complete annual report
Please find page 142 of the 2013 Windstream annual report below. You can navigate through the pages in the report by either clicking on the pages listed below, or by using the keyword search tool below to find specific information within the annual report.-
 1
1 -
2
-
3
-
4
-
5
-
6
-
7
-
8
-
9
-
10
-
11
-
12
-
13
-
14
-
15
-
16
-
17
-
18
-
19
-
20
-
21
-
22
-
23
-
24
-
25
-
26
-
27
-
28
-
29
-
30
-
31
-
32
-
33
-
34
-
35
-
36
-
37
-
38
-
39
-
40
-
41
-
42
-
43
-
44
-
45
-
46
-
47
-
48
-
49
-
50
-
51
-
52
-
53
-
54
-
55
-
56
-
57
-
58
-
59
-
60
-
61
-
62
-
63
-
64
-
65
-
66
-
67
-
68
-
69
-
70
-
71
-
72
-
73
-
74
-
75
-
76
-
77
-
78
-
79
-
80
-
81
-
82
-
83
-
84
-
85
-
86
-
87
-
88
-
89
-
90
-
91
-
92
-
93
-
94
-
95
-
96
-
97
-
98
-
99
-
100
-
101
-
102
-
103
-
104
-
105
-
106
-
107
-
108
-
109
-
110
-
111
-
112
-
113
-
114
-
115
-
116
-
117
-
118
-
119
-
120
-
121
-
122
-
123
-
124
-
125
-
126
-
127
-
128
-
129
-
130
-
131
-
 132
132 -
 133
133 -
 134
134 -
 135
135 -
 136
136 -
 137
137 -
 138
138 -
 139
139 -
 140
140 -
 141
141 -
 142
142 -
 143
143 -
 144
144 -
 145
145 -
 146
146 -
 147
147 -
 148
148 -
 149
149 -
 150
150 -
 151
151 -
 152
152 -
153
-
154
-
155
-
156
-
157
-
158
-
159
-
160
-
161
-
162
-
163
-
164
-
165
-
166
-
167
-
168
-
169
-
170
-
171
-
172
-
173
-
174
-
175
-
176
-
177
-
178
-
179
-
180
-
181
-
182
-
183
-
184
-
185
-
186
-
187
-
188
-
189
-
190
-
191
-
192
-
193
-
194
-
195
-
196
-
197
-
198
-
199
-
200
-
201
-
202
-
203
-
204
-
205
-
206
-
207
-
208
-
209
-
210
-
211
-
212
-
213
-
214
-
215
-
216
-
217
-
218
-
219
-
220
-
221
-
222
-
223
-
224
-
225
-
226
-
227
-
228
-
229
-
230
-
231
-
232
-
233
-
234
-
235
-
236
 |
 |

F-6
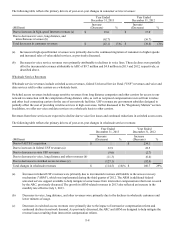
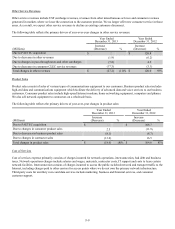
Operating Metrics: (Thousands) 2013 2012 2011
Business Operating Metrics:
Customer locations
Enterprise 210.4 204.6 199.1
Small business 395.3 430.7 467.9
Total customer locations (a) 605.7 635.3 667.0
Total business customers 388.3 417.6 442.3
Carrier special access circuits 100.1 107.2 112.0
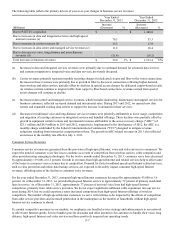
Consumer Operating Metrics:
Voice lines 1,722.3 1,841.9 1,927.9
High-speed Internet 1,170.9 1,214.5 1,207.8
Digital television customers 402.3 426.1 441.2
Total consumer connections 3,295.5 3,482.5 3,576.9
(a) Business customer locations include each individual location to which we provide service and exclude carrier special
access circuits. Business customer locations are segmented between Enterprise locations which represent customer
relationships that generate $750 or more in revenue per month and Small business locations which represent customer
relationships that generate less than $750 in revenue per month.
A detailed discussion and analysis of our consolidated operating results is presented below.
Business Service Revenues
Business service revenues include revenues from integrated voice and data services, advanced data and traditional voice and
long-distance services provided to enterprise and small business customers. Business services also include revenues from other
carriers for special access circuits and fiber connections. We expect business service revenues to continue to be favorably
impacted by increasing demand for integrated data and voice services, multi-site networking and data center services. As
wireless data usage grows and fourth generation ("4G") networks are expanded, we expect to provide access services to support
the capacity needs of wireless carriers. Fiber-to-the-tower initiatives are designed to accommodate network capacity
requirements for wireless carriers as a result of growing wireless data usage.
We experience competition in the business channel primarily from other carriers, including traditional telephone companies and
competitive providers. Cable companies are also a source of competition, primarily for small business customers, but they have
begun to compete for larger customers by expanding their product and sales capabilities.
For the year ended December 31, 2013, total business locations decreased by approximately 29,600 or 4.7 percent. Our growth
in enterprise customer locations is outpaced by losses in small business customer locations, primarily due to business closures
and competition from cable companies. However, our enterprise locations are driving growth in overall revenue through
purchases of integrated voice and data services, data center and managed services, and advanced data services such as multi-
site networking.
While opportunities for growth from business services continue, competition as well as general economic conditions may
impact future revenue growth. In addition, traditional business voice and long-distance service revenues continue to decline due
to competition and migration to more advanced integrated voice and data services.