Windstream 2013 Annual Report Download - page 144
Download and view the complete annual report
Please find page 144 of the 2013 Windstream annual report below. You can navigate through the pages in the report by either clicking on the pages listed below, or by using the keyword search tool below to find specific information within the annual report.-
 1
1 -
2
-
3
-
4
-
5
-
6
-
7
-
8
-
9
-
10
-
11
-
12
-
13
-
14
-
15
-
16
-
17
-
18
-
19
-
20
-
21
-
22
-
23
-
24
-
25
-
26
-
27
-
28
-
29
-
30
-
31
-
32
-
33
-
34
-
35
-
36
-
37
-
38
-
39
-
40
-
41
-
42
-
43
-
44
-
45
-
46
-
47
-
48
-
49
-
50
-
51
-
52
-
53
-
54
-
55
-
56
-
57
-
58
-
59
-
60
-
61
-
62
-
63
-
64
-
65
-
66
-
67
-
68
-
69
-
70
-
71
-
72
-
73
-
74
-
75
-
76
-
77
-
78
-
79
-
80
-
81
-
82
-
83
-
84
-
85
-
86
-
87
-
88
-
89
-
90
-
91
-
92
-
93
-
94
-
95
-
96
-
97
-
98
-
99
-
100
-
101
-
102
-
103
-
104
-
105
-
106
-
107
-
108
-
109
-
110
-
111
-
112
-
113
-
114
-
115
-
116
-
117
-
118
-
119
-
120
-
121
-
122
-
123
-
124
-
125
-
126
-
127
-
128
-
129
-
130
-
131
-
132
-
133
-
 134
134 -
 135
135 -
 136
136 -
 137
137 -
 138
138 -
 139
139 -
 140
140 -
 141
141 -
 142
142 -
 143
143 -
 144
144 -
 145
145 -
 146
146 -
 147
147 -
 148
148 -
 149
149 -
 150
150 -
 151
151 -
 152
152 -
 153
153 -
 154
154 -
155
-
156
-
157
-
158
-
159
-
160
-
161
-
162
-
163
-
164
-
165
-
166
-
167
-
168
-
169
-
170
-
171
-
172
-
173
-
174
-
175
-
176
-
177
-
178
-
179
-
180
-
181
-
182
-
183
-
184
-
185
-
186
-
187
-
188
-
189
-
190
-
191
-
192
-
193
-
194
-
195
-
196
-
197
-
198
-
199
-
200
-
201
-
202
-
203
-
204
-
205
-
206
-
207
-
208
-
209
-
210
-
211
-
212
-
213
-
214
-
215
-
216
-
217
-
218
-
219
-
220
-
221
-
222
-
223
-
224
-
225
-
226
-
227
-
228
-
229
-
230
-
231
-
232
-
233
-
234
-
235
-
236
 |
 |

F-8
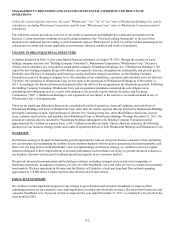
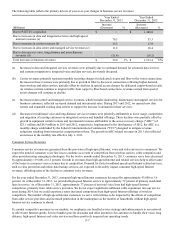
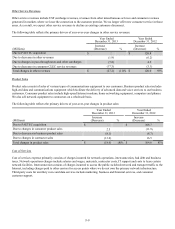
The following table reflects the primary drivers of year-over-year changes in consumer service revenues:
Year Ended
December 31, 2013 Year Ended
December 31, 2012
(Millions) Increase
(Decrease) % Increase
(Decrease) %
Due to increases in high-speed Internet revenues (a) $ 19.6 $ 17.9
Due to decreases in voice, long distance, and
miscellaneous revenues (b) (62.7) (56.7)
Total decreases in consumer revenues $(43.1) (3)% $ (38.8) (3)%
(a) Increases in high-speed Internet revenues were primarily due to the continued migration of customers to higher speeds
and increased sales of value added services, as previously discussed.
(b) Decreases in voice service revenues were primarily attributable to declines in voice lines. These declines were partially
offset by incremental revenues attributable to ARC of $9.7 million and $4.8 million in 2013 and 2012, respectively, as
described above.
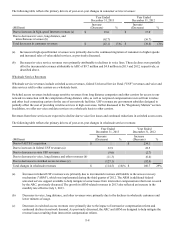
Wholesale Service Revenues
Wholesale service revenues include switched access revenues, federal Universal Service Fund ("USF") revenues and voice and
data services sold to other carriers on a wholesale basis.
Switched access revenues include usage sensitive revenues from long distance companies and other carriers for access to our
network in connection with the completion of long distance calls, as well as reciprocal compensation received from wireless
and other local connecting carriers for the use of our network facilities. USF revenues are government subsidies designed to
partially offset the cost of providing wireline services in high-cost areas, further discussed in the "Regulatory Matters" section.
In addition, we offer our voice and data services on a wholesale basis to other carriers.
Revenues from these services are expected to decline due to voice line losses and continued reductions in switched access rates.
The following table reflects the primary drivers of year-over-year changes in wholesale service revenues:
Year Ended
December 31, 2013 Year Ended
December 31, 2012
(Millions) Increase
(Decrease) % Increase
(Decrease) %
Due to PAETEC acquisition $ — $ 234.1
Due to increases in federal USF revenues (a) 32.9 22.5
Due to decreases in state USF revenues (9.0)(2.7)
Due to decreases in voice, long distance and other revenues (b) (11.3)(0.4)
Due to decreases in switched access revenues (c) (127.1) (92.8)
Total changes in wholesale revenues $ (114.5) (16)% $ 160.7 29%
(a) Increases in federal USF revenues were primarily due to incremental revenues attributable to the access recovery
mechanism ("ARM"), which was implemented during the third quarter of 2012. The ARM is additional federal
universal service support available to help mitigate revenue losses from intercarrier compensation reform not covered
by the ARC, previously discussed. The growth in ARM-related revenues in 2013 also reflected an increase in the
monthly rate effective July 1, 2013.
(b) Decreases in voice, long distance, and other revenues were primarily due to the declines in wholesale customers and
lower minutes of usage.
(c) Decreases in switched access revenues were primarily due to the impact of intercarrier compensation reform and
continued declines in network demand. As previously discussed, the ARC and ARM are designed to help mitigate the
revenue losses resulting from intercarrier compensation reform.