Windstream 2013 Annual Report Download - page 226
Download and view the complete annual report
Please find page 226 of the 2013 Windstream annual report below. You can navigate through the pages in the report by either clicking on the pages listed below, or by using the keyword search tool below to find specific information within the annual report.-
 1
1 -
2
-
3
-
4
-
5
-
6
-
7
-
8
-
9
-
10
-
11
-
12
-
13
-
14
-
15
-
16
-
17
-
18
-
19
-
20
-
21
-
22
-
23
-
24
-
25
-
26
-
27
-
28
-
29
-
30
-
31
-
32
-
33
-
34
-
35
-
36
-
37
-
38
-
39
-
40
-
41
-
42
-
43
-
44
-
45
-
46
-
47
-
48
-
49
-
50
-
51
-
52
-
53
-
54
-
55
-
56
-
57
-
58
-
59
-
60
-
61
-
62
-
63
-
64
-
65
-
66
-
67
-
68
-
69
-
70
-
71
-
72
-
73
-
74
-
75
-
76
-
77
-
78
-
79
-
80
-
81
-
82
-
83
-
84
-
85
-
86
-
87
-
88
-
89
-
90
-
91
-
92
-
93
-
94
-
95
-
96
-
97
-
98
-
99
-
100
-
101
-
102
-
103
-
104
-
105
-
106
-
107
-
108
-
109
-
110
-
111
-
112
-
113
-
114
-
115
-
116
-
117
-
118
-
119
-
120
-
121
-
122
-
123
-
124
-
125
-
126
-
127
-
128
-
129
-
130
-
131
-
132
-
133
-
134
-
135
-
136
-
137
-
138
-
139
-
140
-
141
-
142
-
143
-
144
-
145
-
146
-
147
-
148
-
149
-
150
-
151
-
152
-
153
-
154
-
155
-
156
-
157
-
158
-
159
-
160
-
161
-
162
-
163
-
164
-
165
-
166
-
167
-
168
-
169
-
170
-
171
-
172
-
173
-
174
-
175
-
176
-
177
-
178
-
179
-
180
-
181
-
182
-
183
-
184
-
185
-
186
-
187
-
188
-
189
-
190
-
191
-
192
-
193
-
194
-
195
-
196
-
197
-
198
-
199
-
200
-
201
-
202
-
203
-
204
-
205
-
206
-
207
-
208
-
209
-
210
-
211
-
212
-
213
-
214
-
215
-
 216
216 -
 217
217 -
 218
218 -
 219
219 -
 220
220 -
 221
221 -
 222
222 -
 223
223 -
 224
224 -
 225
225 -
 226
226 -
 227
227 -
 228
228 -
 229
229 -
 230
230 -
 231
231 -
 232
232 -
 233
233 -
 234
234 -
 235
235 -
 236
236
 |
 |
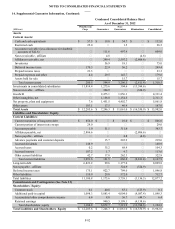
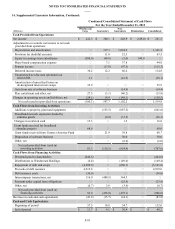
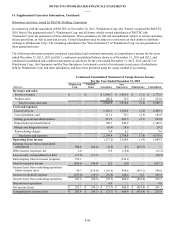
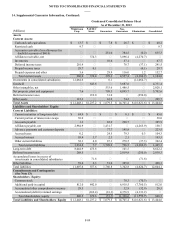
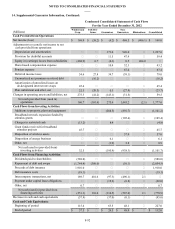
NOTES TO CONSOLIDATED FINANCIAL STATEMENTS
____
F-90
14. Supplemental Guarantor Information, Continued:
Condensed Consolidated Balance Sheet
As of December 31, 2012
(Millions) Windstream
Corp. PAETEC
Issuer Guarantors Non-
Guarantors Eliminations Consolidated
Assets
Current Assets:
Cash and cash equivalents $ 57.5 $ — $ 26.5 $ 48.0 $ — $ 132.0
Restricted cash 25.0 — 1.5 — — 26.5
Accounts receivable (less allowance for
doubtful accounts of $42.6) — — 243.6 365.4 — 609.0
Affiliates receivable, net — 1,080.2 — 3,253.3 (4,333.5) —
Inventories — — 10.0 65.0 — 75.0
Deferred income taxes 170.3 — 6.2 76.7 (3.8) 249.4
Prepaid income taxes 23.3 — — — — 23.3
Prepaid expenses and other 4.4 — 24.2 151.0 — 179.6
Assets held for sale — — 15.7 — — 15.7
Total current assets 280.5 1,080.2 327.7 3,959.4 (4,337.3) 1,310.5
Investments in consolidated subsidiaries 11,814.4 — 0.4 — (11,814.8) —
Goodwill — 643.8 — 3,687.6 — 4,331.4
Other intangibles, net — — 668.9 1,642.4 — 2,311.3
Net property, plant and equipment 7.6 — 877.3 4,976.9 — 5,861.8
Deferred income taxes — 246.4 — — (246.4) —
Other assets 103.1 — 13.1 50.8 — 167.0
Total Assets $ 12,205.6 $ 1,970.4 $ 1,887.4 $ 14,317.1 $ (16,398.5) $ 13,982.0
Liabilities and Shareholders’ Equity
Current Liabilities:
Current maturities of long-term debt $ 856.0 $ — $ — $ 10.0 $ — $ 866.0
Current portion of interest rate swaps 29.0 — — — — 29.0
Accounts payable 1.0 — 83.4 279.3 — 363.7
Affiliates payable, net 2,806.6 — 1,525.0 — (4,331.6) —
Advance payments and customer deposits — — 74.0 145.6 — 219.6
Accrued dividends 148.9 — — — — 148.9
Accrued taxes 0.2 — 33.6 70.1 0.4 104.3
Accrued interest 107.2 3.9 0.8 1.7 — 113.6
Other current liabilities 42.7 3.8 81.9 198.2 (3.8) 322.8
Total current liabilities 3,991.6 7.7 1,798.7 704.9 (4,335.0) 2,167.9
Long-term debt 6,823.2 1,175.0 — 101.6 — 8,099.8
Deferred income taxes 175.1 — 33.1 1,935.0 (246.4) 1,896.8
Accumulated losses in excess of
investments in consolidated subsidiaries — 5.3 — — (5.3) —
Other liabilities 110.9 3.4 63.1 535.3 — 712.7
Total liabilities 11,100.8 1,191.4 1,894.9 3,276.8 (4,586.7) 12,877.2
Commitments and Contingencies
(See Note 13)
Shareholders’ Equity:
Common stock 0.1 — — 70.3 (70.3) 0.1
Additional paid-in capital 1,098.3 842.0 — 6,918.5 (7,760.5) 1,098.3
Accumulated other comprehensive
income 6.4 — — 50.8 (50.8) 6.4
Accumulated (deficit) retained earnings — (63.0)(7.5) 4,000.7 (3,930.2) —
Total shareholders’ equity 1,104.8 779.0 (7.5) 11,040.3 (11,811.8) 1,104.8
Total Liabilities and Shareholders’
Equity $ 12,205.6 $ 1,970.4 $ 1,887.4 $ 14,317.1 $ (16,398.5) $ 13,982.0