Windstream 2013 Annual Report Download - page 228
Download and view the complete annual report
Please find page 228 of the 2013 Windstream annual report below. You can navigate through the pages in the report by either clicking on the pages listed below, or by using the keyword search tool below to find specific information within the annual report.-
 1
1 -
2
-
3
-
4
-
5
-
6
-
7
-
8
-
9
-
10
-
11
-
12
-
13
-
14
-
15
-
16
-
17
-
18
-
19
-
20
-
21
-
22
-
23
-
24
-
25
-
26
-
27
-
28
-
29
-
30
-
31
-
32
-
33
-
34
-
35
-
36
-
37
-
38
-
39
-
40
-
41
-
42
-
43
-
44
-
45
-
46
-
47
-
48
-
49
-
50
-
51
-
52
-
53
-
54
-
55
-
56
-
57
-
58
-
59
-
60
-
61
-
62
-
63
-
64
-
65
-
66
-
67
-
68
-
69
-
70
-
71
-
72
-
73
-
74
-
75
-
76
-
77
-
78
-
79
-
80
-
81
-
82
-
83
-
84
-
85
-
86
-
87
-
88
-
89
-
90
-
91
-
92
-
93
-
94
-
95
-
96
-
97
-
98
-
99
-
100
-
101
-
102
-
103
-
104
-
105
-
106
-
107
-
108
-
109
-
110
-
111
-
112
-
113
-
114
-
115
-
116
-
117
-
118
-
119
-
120
-
121
-
122
-
123
-
124
-
125
-
126
-
127
-
128
-
129
-
130
-
131
-
132
-
133
-
134
-
135
-
136
-
137
-
138
-
139
-
140
-
141
-
142
-
143
-
144
-
145
-
146
-
147
-
148
-
149
-
150
-
151
-
152
-
153
-
154
-
155
-
156
-
157
-
158
-
159
-
160
-
161
-
162
-
163
-
164
-
165
-
166
-
167
-
168
-
169
-
170
-
171
-
172
-
173
-
174
-
175
-
176
-
177
-
178
-
179
-
180
-
181
-
182
-
183
-
184
-
185
-
186
-
187
-
188
-
189
-
190
-
191
-
192
-
193
-
194
-
195
-
196
-
197
-
198
-
199
-
200
-
201
-
202
-
203
-
204
-
205
-
206
-
207
-
208
-
209
-
210
-
211
-
212
-
213
-
214
-
215
-
216
-
217
-
 218
218 -
 219
219 -
 220
220 -
 221
221 -
 222
222 -
 223
223 -
 224
224 -
 225
225 -
 226
226 -
 227
227 -
 228
228 -
 229
229 -
 230
230 -
 231
231 -
 232
232 -
 233
233 -
 234
234 -
 235
235 -
 236
236
 |
 |

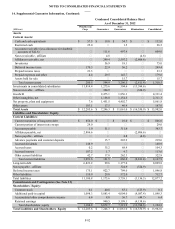
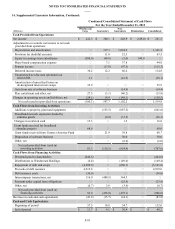
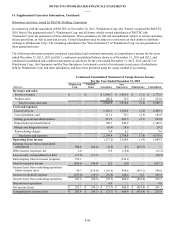
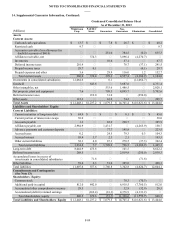
NOTES TO CONSOLIDATED FINANCIAL STATEMENTS
____
F-92
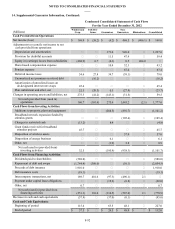
14. Supplemental Guarantor Information, Continued:
Condensed Consolidated Statement of Cash Flows
For the Year Ended December 31, 2012
(Millions) Windstream
Corp. PAETEC
Issuer Guarantors Non-
Guarantors Eliminations Consolidated
Cash Provided from Operations:
Net income (loss) $ 168.0 $ (58.2) $ (4.2) $ 468.5 $ (406.1) $ 168.0
Adjustments to reconcile net income to net
cash provided from operations:
Depreciation and amortization — — 371.6 926.0 — 1,297.6
Provision for doubtful accounts — — 11.5 47.9 — 59.4
Equity in (earnings) losses from subsidiaries (404.9) 6.7 (6.3) 0.5 404.0 —
Share-based compensation expense — — 10.9 32.3 — 43.2
Pension expense — — — 67.4 — 67.4
Deferred income taxes 54.6 27.8 34.7 (38.1) — 79.0
Unamortized net premium on retired debt —(16.2) — — — (16.2)
Amortization of unrealized losses on
de-designated interest rate swaps 45.4 — — — — 45.4
Plan curtailment and other, net 22.3 (20.5) 0.3 (27.8) — (25.7)
Changes in operating assets and liabilities, net 275.3 (41.2)(143.1)(31.5) — 59.5
Net cash provided from (used in)
operations 160.7 (101.6) 275.4 1,445.2 (2.1) 1,777.6
Cash Flows from Investing Activities:
Additions to property, plant and equipment — — (208.5)(892.7) — (1,101.2)
Broadband network expansion funded by
stimulus grants — — — (105.4) — (105.4)
Changes in restricted cash (13.2) — 8.4 — — (4.8)
Grant funds received for broadband
stimulus projects 45.7 — — — — 45.7
Disposition of wireless assets — — — 57.0 — 57.0
Disposition of energy business — — 6.1 — — 6.1
Other, net — — (1.9) 2.8 — 0.9
Net cash used in (provided from)
investing activities 32.5 — (195.9)(938.3) — (1,101.7)
Cash Flows from Financing Activities:
Dividends paid to shareholders (588.0) — — — — (588.0)
Repayment of debt and swaps (1,744.4) (300.0) — (10.1) — (2,054.5)
Proceeds of debt issuance 1,910.0 — — — — 1,910.0
Debt issuance costs (19.1) — — — — (19.1)
Intercompany transactions, net 189.7 401.6 (97.3)(496.1) 2.1 —
Payment under capital lease obligations — — (19.2)(0.8) — (20.0)
Other, net 0.7 — — — — 0.7
Net cash (used in) provided from
financing activities (251.1) 101.6 (116.5)(507.0) 2.1 (770.9)
Decrease in cash and cash equivalents (57.9) — (37.0)(0.1) — (95.0)
Cash and Cash Equivalents:
Beginning of period 115.4 — 63.5 48.1 — 227.0
End of period $ 57.5 $ — $ 26.5 $ 48.0 $ — $ 132.0