Windstream 2013 Annual Report Download - page 223
Download and view the complete annual report
Please find page 223 of the 2013 Windstream annual report below. You can navigate through the pages in the report by either clicking on the pages listed below, or by using the keyword search tool below to find specific information within the annual report.-
 1
1 -
2
-
3
-
4
-
5
-
6
-
7
-
8
-
9
-
10
-
11
-
12
-
13
-
14
-
15
-
16
-
17
-
18
-
19
-
20
-
21
-
22
-
23
-
24
-
25
-
26
-
27
-
28
-
29
-
30
-
31
-
32
-
33
-
34
-
35
-
36
-
37
-
38
-
39
-
40
-
41
-
42
-
43
-
44
-
45
-
46
-
47
-
48
-
49
-
50
-
51
-
52
-
53
-
54
-
55
-
56
-
57
-
58
-
59
-
60
-
61
-
62
-
63
-
64
-
65
-
66
-
67
-
68
-
69
-
70
-
71
-
72
-
73
-
74
-
75
-
76
-
77
-
78
-
79
-
80
-
81
-
82
-
83
-
84
-
85
-
86
-
87
-
88
-
89
-
90
-
91
-
92
-
93
-
94
-
95
-
96
-
97
-
98
-
99
-
100
-
101
-
102
-
103
-
104
-
105
-
106
-
107
-
108
-
109
-
110
-
111
-
112
-
113
-
114
-
115
-
116
-
117
-
118
-
119
-
120
-
121
-
122
-
123
-
124
-
125
-
126
-
127
-
128
-
129
-
130
-
131
-
132
-
133
-
134
-
135
-
136
-
137
-
138
-
139
-
140
-
141
-
142
-
143
-
144
-
145
-
146
-
147
-
148
-
149
-
150
-
151
-
152
-
153
-
154
-
155
-
156
-
157
-
158
-
159
-
160
-
161
-
162
-
163
-
164
-
165
-
166
-
167
-
168
-
169
-
170
-
171
-
172
-
173
-
174
-
175
-
176
-
177
-
178
-
179
-
180
-
181
-
182
-
183
-
184
-
185
-
186
-
187
-
188
-
189
-
190
-
191
-
192
-
193
-
194
-
195
-
196
-
197
-
198
-
199
-
200
-
201
-
202
-
203
-
204
-
205
-
206
-
207
-
208
-
209
-
210
-
211
-
212
-
 213
213 -
 214
214 -
 215
215 -
 216
216 -
 217
217 -
 218
218 -
 219
219 -
 220
220 -
 221
221 -
 222
222 -
 223
223 -
 224
224 -
 225
225 -
 226
226 -
 227
227 -
 228
228 -
 229
229 -
 230
230 -
 231
231 -
 232
232 -
 233
233 -
234
-
235
-
236
 |
 |
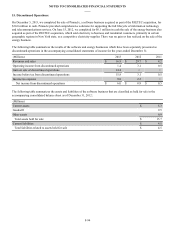
NOTES TO CONSOLIDATED FINANCIAL STATEMENTS
____
F-87
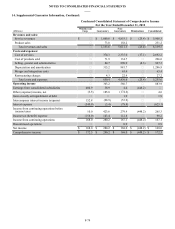
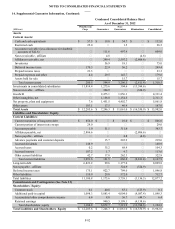
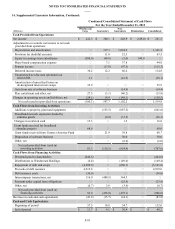
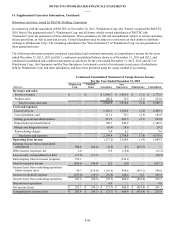
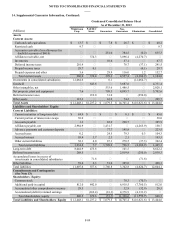
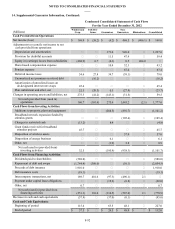
14. Supplemental Guarantor Information, Continued:
Condensed Consolidated Statement of Comprehensive Income
For the Year Ended December 31, 2012
(Millions) Windstream
Corp. PAETEC
Issuer Guarantors Non-
Guarantors Eliminations Consolidated
Revenues and sales:
Service revenues $ — $ — $ 1,977.7 $ 3,938.6 $ (8.0) $ 5,908.3
Product sales — — 120.2 111.0 — 231.2
Total revenues and sales — — 2,097.9 4,049.6 (8.0) 6,139.5
Costs and expenses:
Cost of services — — 1,162.4 1,533.4 (3.6) 2,692.2
Cost of products sold — — 99.9 106.7 — 206.6
Selling, general and administrative — — 473.0 495.3 (1.0) 967.3
Depreciation and amortization — — 370.9 926.0 — 1,296.9
Merger and integration costs — — 0.5 64.9 — 65.4
Restructuring charges — — 9.4 17.8 — 27.2
Total costs and expenses — — 2,116.1 3,144.1 (4.6) 5,255.6
Operating (loss) income — — (18.2) 905.5 (3.4) 883.9
Earnings (losses) from consolidated
subsidiaries 404.9 (6.7) 6.3 (0.5)(404.0) —
Other (expense) income, net (6.8) — 0.3 11.1 — 4.6
Gain on early extinguishment of debt — 1.9 — — — 1.9
Intercompany interest income (expense) 152.8 — — (152.8) — —
Interest (expense) income (540.9) (84.2)(1.2) 1.2 — (625.1)
Income (loss) from continuing operations
before income taxes 10.0 (89.0)(12.8) 764.5 (407.4) 265.3
Income tax (benefit) expense (158.0) (30.8)(7.7) 296.0 (1.3) 98.2
Income (loss) from continuing operations 168.0 (58.2)(5.1) 468.5 (406.1) 167.1
Discontinued operations — — 0.9 — — 0.9
Net income (loss) $ 168.0 $ (58.2) $ (4.2) $ 468.5 $ (406.1) $ 168.0
Comprehensive income (loss) $ 172.5 $ (58.2) $ (4.2) $ 468.5 $ (406.1) $ 172.5