Windstream 2013 Annual Report Download - page 148
Download and view the complete annual report
Please find page 148 of the 2013 Windstream annual report below. You can navigate through the pages in the report by either clicking on the pages listed below, or by using the keyword search tool below to find specific information within the annual report.-
 1
1 -
2
-
3
-
4
-
5
-
6
-
7
-
8
-
9
-
10
-
11
-
12
-
13
-
14
-
15
-
16
-
17
-
18
-
19
-
20
-
21
-
22
-
23
-
24
-
25
-
26
-
27
-
28
-
29
-
30
-
31
-
32
-
33
-
34
-
35
-
36
-
37
-
38
-
39
-
40
-
41
-
42
-
43
-
44
-
45
-
46
-
47
-
48
-
49
-
50
-
51
-
52
-
53
-
54
-
55
-
56
-
57
-
58
-
59
-
60
-
61
-
62
-
63
-
64
-
65
-
66
-
67
-
68
-
69
-
70
-
71
-
72
-
73
-
74
-
75
-
76
-
77
-
78
-
79
-
80
-
81
-
82
-
83
-
84
-
85
-
86
-
87
-
88
-
89
-
90
-
91
-
92
-
93
-
94
-
95
-
96
-
97
-
98
-
99
-
100
-
101
-
102
-
103
-
104
-
105
-
106
-
107
-
108
-
109
-
110
-
111
-
112
-
113
-
114
-
115
-
116
-
117
-
118
-
119
-
120
-
121
-
122
-
123
-
124
-
125
-
126
-
127
-
128
-
129
-
130
-
131
-
132
-
133
-
134
-
135
-
136
-
137
-
 138
138 -
 139
139 -
 140
140 -
 141
141 -
 142
142 -
 143
143 -
 144
144 -
 145
145 -
 146
146 -
 147
147 -
 148
148 -
 149
149 -
 150
150 -
 151
151 -
 152
152 -
 153
153 -
 154
154 -
 155
155 -
 156
156 -
 157
157 -
 158
158 -
159
-
160
-
161
-
162
-
163
-
164
-
165
-
166
-
167
-
168
-
169
-
170
-
171
-
172
-
173
-
174
-
175
-
176
-
177
-
178
-
179
-
180
-
181
-
182
-
183
-
184
-
185
-
186
-
187
-
188
-
189
-
190
-
191
-
192
-
193
-
194
-
195
-
196
-
197
-
198
-
199
-
200
-
201
-
202
-
203
-
204
-
205
-
206
-
207
-
208
-
209
-
210
-
211
-
212
-
213
-
214
-
215
-
216
-
217
-
218
-
219
-
220
-
221
-
222
-
223
-
224
-
225
-
226
-
227
-
228
-
229
-
230
-
231
-
232
-
233
-
234
-
235
-
236
 |
 |

F-12
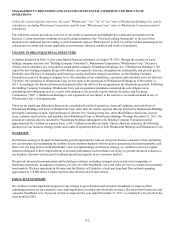
(a) Increases in depreciation expense were primarily due to additions in property, plant and equipment. Additionally, new
depreciation rates were implemented beginning in the first half of 2012 for certain subsidiaries, which resulted in a net
increase to depreciation expense of $59.1 million for the year ended December 31, 2012.
(b) Decreases in amortization expense reflected the use of sum of the years digits method used for customer lists. The
effect of using an accelerated amortization method results in incremental declines in expense each year as the related
intangible assets amortize.
Merger, Integration and Restructuring Costs
We incur a significant amount of costs to complete a merger or acquisition and integrate its operations into our business, which
are presented as merger and integration expense in our results of operations. These costs include transaction costs, such as
accounting, legal and broker fees; severance and related costs; IT and network conversion; rebranding; and consulting fees. Our
recent acquisitions of PAETEC, NuVox, Iowa Telecom, Q-Comm, and Hosted Solutions (collectively the "Acquired
Companies") described in the sections entitled "Strategic Acquisitions" and "Other Acquisitions" in Part I, "Item I Business" in
this annual report accounted for the merger and integration costs incurred for the years presented.
Restructuring charges are generally incurred as a result of evaluations of our operating structure. Among other things, these
evaluations explore opportunities to provide greater flexibility in managing and financing existing and future strategic
operations for task automation, network efficiency and the balancing of our workforce based on the current needs of our
customers. Severance, lease exit costs and other related charges are included in restructuring charges.
On May 31, 2012, we announced that we were undertaking a review of our existing management structure with the intent of
improving the efficiency of our decision-making processes, ensuring our management structure is as simple and as responsive
to customers as possible and positioning ourselves for continued success. We eliminated approximately 350 management
positions as part of the restructuring, which was completed in the third quarter of 2012 and resulted in severance related costs
of $22.4 million.
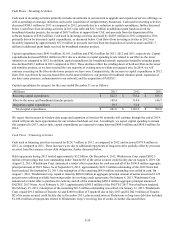
Set forth below is a summary of restructuring and merger and integration costs for the years ended December 31:
(Millions) 2013 2012 2011
Merger and integration costs
Transaction costs associated with acquisitions (a) $ — $ 7.1 $ 40.7
Employee related transition costs (b) 7.8 20.3 22.3
Information technology conversion costs (c) 9.5 6.1 5.7
Rebranding, consulting and other costs (d) 11.9 31.9 1.1
Total merger and integration costs 29.2 65.4 69.8
Restructuring charges (e) 9.6 27.2 1.3
Total merger, integration and restructuring charges $ 38.8 $ 92.6 $ 71.1
(a) Transaction costs in 2012 and 2011 primarily relate to accounting, legal and broker fees and other miscellaneous costs
associated with the acquisitions of the Acquired Companies, respectively. These costs are considered indirect or
general and are expensed when incurred.
(b) Employee related transition costs primarily consist of severance related to the integration of the Acquired Companies.
(c) Information technology conversion costs primarily consisted of redundant IT platform integrations aimed at improving
processes and efficiencies.
(d) In 2013, rebranding, consulting and other costs primarily consist of consulting fees related to network efficiency
projects. In 2012, these costs primarily reflected the nationwide rebranding of the PAETEC markets and consulting
fees related to integration activities.
(e) In 2013, we incurred charges related to a voluntary workforce reduction initiated to better align our focus on enterprise
customer opportunities. In 2012, these charges primarily related to the management restructuring initiative discussed
above.