Windstream 2013 Annual Report Download - page 146
Download and view the complete annual report
Please find page 146 of the 2013 Windstream annual report below. You can navigate through the pages in the report by either clicking on the pages listed below, or by using the keyword search tool below to find specific information within the annual report.-
 1
1 -
2
-
3
-
4
-
5
-
6
-
7
-
8
-
9
-
10
-
11
-
12
-
13
-
14
-
15
-
16
-
17
-
18
-
19
-
20
-
21
-
22
-
23
-
24
-
25
-
26
-
27
-
28
-
29
-
30
-
31
-
32
-
33
-
34
-
35
-
36
-
37
-
38
-
39
-
40
-
41
-
42
-
43
-
44
-
45
-
46
-
47
-
48
-
49
-
50
-
51
-
52
-
53
-
54
-
55
-
56
-
57
-
58
-
59
-
60
-
61
-
62
-
63
-
64
-
65
-
66
-
67
-
68
-
69
-
70
-
71
-
72
-
73
-
74
-
75
-
76
-
77
-
78
-
79
-
80
-
81
-
82
-
83
-
84
-
85
-
86
-
87
-
88
-
89
-
90
-
91
-
92
-
93
-
94
-
95
-
96
-
97
-
98
-
99
-
100
-
101
-
102
-
103
-
104
-
105
-
106
-
107
-
108
-
109
-
110
-
111
-
112
-
113
-
114
-
115
-
116
-
117
-
118
-
119
-
120
-
121
-
122
-
123
-
124
-
125
-
126
-
127
-
128
-
129
-
130
-
131
-
132
-
133
-
134
-
135
-
 136
136 -
 137
137 -
 138
138 -
 139
139 -
 140
140 -
 141
141 -
 142
142 -
 143
143 -
 144
144 -
 145
145 -
 146
146 -
 147
147 -
 148
148 -
 149
149 -
 150
150 -
 151
151 -
 152
152 -
 153
153 -
 154
154 -
 155
155 -
 156
156 -
157
-
158
-
159
-
160
-
161
-
162
-
163
-
164
-
165
-
166
-
167
-
168
-
169
-
170
-
171
-
172
-
173
-
174
-
175
-
176
-
177
-
178
-
179
-
180
-
181
-
182
-
183
-
184
-
185
-
186
-
187
-
188
-
189
-
190
-
191
-
192
-
193
-
194
-
195
-
196
-
197
-
198
-
199
-
200
-
201
-
202
-
203
-
204
-
205
-
206
-
207
-
208
-
209
-
210
-
211
-
212
-
213
-
214
-
215
-
216
-
217
-
218
-
219
-
220
-
221
-
222
-
223
-
224
-
225
-
226
-
227
-
228
-
229
-
230
-
231
-
232
-
233
-
234
-
235
-
236
 |
 |

F-10
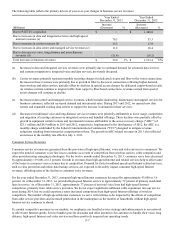
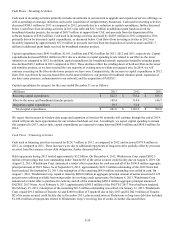
The following table reflects the primary drivers of year-over-year changes in cost of services:
Year Ended
December 31, 2013 Year Ended
December 31, 2012
(Millions) Increase
(Decrease) % Increase
(Decrease) %
Due to PAETEC acquisition $ — $ 1,044.8
Due to increases in network operations (a) 44.4 5.2
Due to decreases in other expenses (6.4)(0.9)
Due to changes in federal USF expenses (b) (13.3) 5.5
Due to changes in third-party costs for ancillary voice and
data services (c) (15.6) 12.0
Due to changes in interconnection expense (d) (53.9) 5.3
Due to decreases in pension and postretirement expense (e) (155.3)(70.8)
Total changes in cost of services $ (200.1) (7)% $ 1,001.1 59%
(a) Increases in network operations were primarily due to higher leased network facilities costs attributable to expansion
of our fiber transport network and data center operations due to adding new data centers in 2013 and 2012.
(b) The decrease in federal USF contributions during 2013 was driven by a reduction in the overall USF contribution
factor. The increase in 2012 was attributable to an increase in the contribution factor compared to 2011.
(c) The decrease in third-party costs for ancillary voice and data services in 2013 was primarily due to lower costs
associated with promotional offerings.
(d) The decrease in 2013 in interconnection expense was attributable to the favorable impact of network efficiency
projects, rate reductions primarily driven by intercarrier compensation reform, and lower long distance usage by our
customers, partially offset by increased purchases of circuits to service the growth in data customers, as well as higher
capacity circuits to service existing customers and increase the transport capacity of our network.
(e) Decrease in pension and postretirement expense in 2013 reflected the effects of an actuarial gain of $110.4 million
primarily attributable to an increase in the discount rate utilized to measure our pension obligations from 3.85 percent
in 2012 to 5.01 percent in 2013, of which $83.7 million was recorded to cost of services. In addition, we recognized
curtailment gains totaling $32.2 million in 2013 resulting from the elimination of medical and prescription subsidies
for certain active and retired participants, of which $24.1 million was recorded to cost of services. The decrease in
2012 was primarily due to our pension plan assets performing better than expected, partially offset by the effects of
decreasing the discount rate from 4.64 percent in 2011 to 3.85 percent in 2012. See Note 8 to the consolidated
financial statements for additional information regarding our pension and postretirement benefit plans.
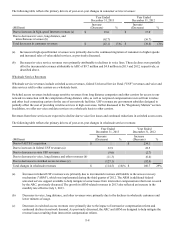
Cost of Products Sold
Cost of products sold represents the cost of equipment sales to customers. Changes in cost of products sold were generally
consistent with the changes in product sales.
The following table reflects the primary drivers of year-over-year changes in cost of products sold:
Year Ended
December 31, 2013 Year Ended
December 31, 2012
(Millions) Increase
(Decrease) % Increase
(Decrease) %
Due to PAETEC acquisition $ — $ 90.1
Due to changes in product sales to consumers 0.8 (1.1)
Due to decreases in product sales to business customers (8.9)(4.7)
Due to changes in sales to contractors (14.6) 17.2
Total changes in cost of products sold $(22.7) (11)% $ 101.5 97%