Windstream 2013 Annual Report Download - page 143
Download and view the complete annual report
Please find page 143 of the 2013 Windstream annual report below. You can navigate through the pages in the report by either clicking on the pages listed below, or by using the keyword search tool below to find specific information within the annual report.-
 1
1 -
2
-
3
-
4
-
5
-
6
-
7
-
8
-
9
-
10
-
11
-
12
-
13
-
14
-
15
-
16
-
17
-
18
-
19
-
20
-
21
-
22
-
23
-
24
-
25
-
26
-
27
-
28
-
29
-
30
-
31
-
32
-
33
-
34
-
35
-
36
-
37
-
38
-
39
-
40
-
41
-
42
-
43
-
44
-
45
-
46
-
47
-
48
-
49
-
50
-
51
-
52
-
53
-
54
-
55
-
56
-
57
-
58
-
59
-
60
-
61
-
62
-
63
-
64
-
65
-
66
-
67
-
68
-
69
-
70
-
71
-
72
-
73
-
74
-
75
-
76
-
77
-
78
-
79
-
80
-
81
-
82
-
83
-
84
-
85
-
86
-
87
-
88
-
89
-
90
-
91
-
92
-
93
-
94
-
95
-
96
-
97
-
98
-
99
-
100
-
101
-
102
-
103
-
104
-
105
-
106
-
107
-
108
-
109
-
110
-
111
-
112
-
113
-
114
-
115
-
116
-
117
-
118
-
119
-
120
-
121
-
122
-
123
-
124
-
125
-
126
-
127
-
128
-
129
-
130
-
131
-
132
-
 133
133 -
 134
134 -
 135
135 -
 136
136 -
 137
137 -
 138
138 -
 139
139 -
 140
140 -
 141
141 -
 142
142 -
 143
143 -
 144
144 -
 145
145 -
 146
146 -
 147
147 -
 148
148 -
 149
149 -
 150
150 -
 151
151 -
 152
152 -
 153
153 -
154
-
155
-
156
-
157
-
158
-
159
-
160
-
161
-
162
-
163
-
164
-
165
-
166
-
167
-
168
-
169
-
170
-
171
-
172
-
173
-
174
-
175
-
176
-
177
-
178
-
179
-
180
-
181
-
182
-
183
-
184
-
185
-
186
-
187
-
188
-
189
-
190
-
191
-
192
-
193
-
194
-
195
-
196
-
197
-
198
-
199
-
200
-
201
-
202
-
203
-
204
-
205
-
206
-
207
-
208
-
209
-
210
-
211
-
212
-
213
-
214
-
215
-
216
-
217
-
218
-
219
-
220
-
221
-
222
-
223
-
224
-
225
-
226
-
227
-
228
-
229
-
230
-
231
-
232
-
233
-
234
-
235
-
236
 |
 |

F-7
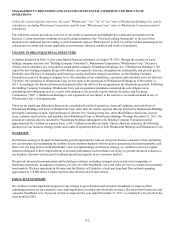
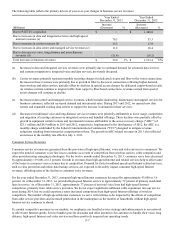
The following table reflects the primary drivers of year-over-year changes in business service revenues:
Year Ended
December 31, 2013 Year Ended
December 31, 2012
(Millions) Increase
(Decrease) % Increase
(Decrease) %
Due to PAETEC acquisition $ — $ 1,446.0
Due to increases in data and integrated services and high-speed
internet revenues (a) 76.3 55.3
Due to increases in carrier revenues (b) 15.3 17.9
Due to increases in data center and managed service revenues (c) 11.8 10.4
Due to decreases in voice, long distance and miscellaneous
revenues (d) (51.4) (16.2)
Total increases in business revenues $ 52.0 1% $ 1,513.4 72%
(a) Increases in data and integrated services revenues were primarily due to continued demand for advanced data services
and customer migration to integrated voice and data services, previously discussed.
(b) Carrier revenues primarily represent monthly recurring charges for dedicated circuits and fiber-to-the-tower connections.
Increases in these revenues were primarily due to growth in fiber-to-the-tower connections reflecting higher demand
from wireless and other carriers, partially offset by declines in special access charges for dedicated copper-based circuits.
As wireless carriers continue to migrate traffic from copper to fiber-based connections, revenues earned from special
access charges will continue to decline.
(c) Increases in data center and managed service revenues, which includes monitoring, maintenance and support services for
business customers, reflected increased demand and incremental sales. During 2013 and 2012, we opened new data
centers and expanded existing data centers to support the increase in demand for these services.
(d) Decreases in traditional voice and long-distance service revenues were primarily attributable to lower usage, competition
and migration of existing customers to integrated services and bundled offerings. These declines were partially offset by
growth in equipment rental revenues and incremental revenues attributable to the access recovery charge ("ARC") of
$23.1 million and $8.9 million in 2013 and 2012, respectively. Implemented in the third quarter of 2012, the ARC is a
monthly charge established by the Federal Communications Commission ("FCC") designed to mitigate revenue
reductions resulting from intercarrier compensation reform. The growth in ARC-related revenues in 2013 also reflected
an increase in the monthly rate effective July 1, 2013.
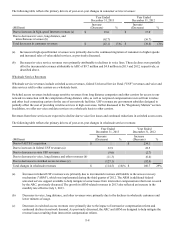
Consumer Service Revenues
Consumer service revenues are generated from the provision of high-speed Internet, voice and video services to consumers. We
expect the trend of consumer voice line loss to continue as a result of competition from wireless carriers, cable companies and
other providers using emerging technologies. For the twelve months ended December 31, 2013, consumer voice lines decreased
by approximately 119,600, or 6.5 percent. Growth in revenues from high-speed Internet and related services help to offset some
of the losses in consumer voice revenues due to competition. Demand for faster broadband speeds and Internet-related services,
such as virus protection and online data backup services, are expected to favorably impact consumer high-speed Internet
revenues, offsetting some of the decline in consumer voice revenues.
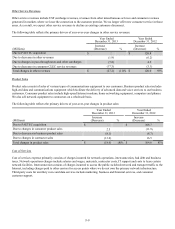
For the year ended December 31, 2013, consumer high-speed Internet customers decreased by approximately 43,600 or 3.6
percent. As of December 31, 2013, we provided high-speed Internet service to approximately 72 percent of primary residential
lines in service. As of December 31, 2013, approximately 77 percent of our total voice lines had high-speed Internet
competition, primarily from cable service providers. We do not expect significant additional cable expansions into our service
areas during 2014, but we could experience some increased competition from high-speed Internet offerings of wireless
competitors. The number of high-speed Internet customers we serve will continue to be impacted by the effects of competition
from other service providers and increased penetration in the marketplace as the number of households without high-speed
Internet service continues to shrink.
To combat competitive pressures in our markets, we emphasize our bundled service strategy and enhancements to our network
to offer faster Internet speeds. Service bundles provide discounts and other incentives for customers to bundle their voice, long
distance, high-speed Internet and video services and have positively impacted our operating trends.