Windstream 2013 Annual Report Download - page 35
Download and view the complete annual report
Please find page 35 of the 2013 Windstream annual report below. You can navigate through the pages in the report by either clicking on the pages listed below, or by using the keyword search tool below to find specific information within the annual report.-
 1
1 -
2
-
3
-
4
-
5
-
6
-
7
-
8
-
9
-
10
-
11
-
12
-
13
-
14
-
15
-
16
-
17
-
18
-
19
-
20
-
21
-
22
-
23
-
24
-
 25
25 -
 26
26 -
 27
27 -
 28
28 -
 29
29 -
 30
30 -
 31
31 -
 32
32 -
 33
33 -
 34
34 -
 35
35 -
 36
36 -
 37
37 -
 38
38 -
 39
39 -
 40
40 -
 41
41 -
 42
42 -
 43
43 -
 44
44 -
 45
45 -
46
-
47
-
48
-
49
-
50
-
51
-
52
-
53
-
54
-
55
-
56
-
57
-
58
-
59
-
60
-
61
-
62
-
63
-
64
-
65
-
66
-
67
-
68
-
69
-
70
-
71
-
72
-
73
-
74
-
75
-
76
-
77
-
78
-
79
-
80
-
81
-
82
-
83
-
84
-
85
-
86
-
87
-
88
-
89
-
90
-
91
-
92
-
93
-
94
-
95
-
96
-
97
-
98
-
99
-
100
-
101
-
102
-
103
-
104
-
105
-
106
-
107
-
108
-
109
-
110
-
111
-
112
-
113
-
114
-
115
-
116
-
117
-
118
-
119
-
120
-
121
-
122
-
123
-
124
-
125
-
126
-
127
-
128
-
129
-
130
-
131
-
132
-
133
-
134
-
135
-
136
-
137
-
138
-
139
-
140
-
141
-
142
-
143
-
144
-
145
-
146
-
147
-
148
-
149
-
150
-
151
-
152
-
153
-
154
-
155
-
156
-
157
-
158
-
159
-
160
-
161
-
162
-
163
-
164
-
165
-
166
-
167
-
168
-
169
-
170
-
171
-
172
-
173
-
174
-
175
-
176
-
177
-
178
-
179
-
180
-
181
-
182
-
183
-
184
-
185
-
186
-
187
-
188
-
189
-
190
-
191
-
192
-
193
-
194
-
195
-
196
-
197
-
198
-
199
-
200
-
201
-
202
-
203
-
204
-
205
-
206
-
207
-
208
-
209
-
210
-
211
-
212
-
213
-
214
-
215
-
216
-
217
-
218
-
219
-
220
-
221
-
222
-
223
-
224
-
225
-
226
-
227
-
228
-
229
-
230
-
231
-
232
-
233
-
234
-
235
-
236
 |
 |
| 29
earnings releases. The Adjusted OIBDA measure excludes merger and integration costs, pension (income) expense,
share-based compensation, and restructuring charges. Total Revenue is a GAAP measure that is included in the Form
10-K. Payout Ratio is defined as Dividends paid/Adjusted Free Cash Flow, which is defined as Adjusted OIBDA
less cash interest, cash taxes and capital expenditures (excluding integration capital). Windstream provides the
methodology for calculating Adjusted OIBDA and payout ratio in the Current Report on Form 8-K that accompanies
its quarterly earnings releases. Payments under the short-term incentive plan have historically been based solely on
Adjusted OIBDA. The Compensation Committee has utilized Adjusted OIBDA as a performance metric because it
is the key indicator of profitability that ensures Windstream’s ability to generate sustainable cash flows over a long
period of time. The Committee included a revenue component because revenue is a strong indicator of the Company’s
performance year-over-year and overall financial condition. Payout ratio was added to the short-term incentive plan
to focus on cash flow to fund the dividend and is a key metric followed by our investors and the capital markets.
Under the Windstream short-term incentive plan, executive officers were eligible to receive payments in
proportion to Windstream’s achievement of a performance goal that was set at minimum (or threshold), target and
maximum levels. For 2013, payouts were based 60% on the achievement of the Adjusted OIBDA goal, 20% based on
the achievement of the Total Revenue goal, and 20% on the Payout Ratio goal. The Compensation Committee set each
performance goal at levels that it believes to be difficult but achievable and designed to drive industry-leading results.
The executive officers were eligible to receive 50% to 200% of the target payout amounts if threshold or maximum
levels, respectively, were achieved. No payout is made if performance is below the threshold levels, and performance
between threshold, target and maximum levels results in prorated payouts. During 2013, the threshold Adjusted
OIBDA amount was $2.278 billion, the target was $2.363 billion and the maximum was $2.447 billion, the threshold
Total Revenue amount was $5.936 billion, the target was $6.121 billion and the maximum was $6.306 billion, and the
threshold payout ratio was 67.5%, the target was 63.5-65.3% and the maximum amount was 60.0%. The payout ratio
target was based on a range to reflect success-based capital expenditures. Windstream’s actual Adjusted OIBDA for
2013 was $2.318 billion, which reflected an approximate 74% achievement against the target performance goal. Its
actual Total Revenue for 2013 was $5.988 billion, which reflected an approximate 64% achievement level against the
target performance goal. The Payout Ratio for 2013 was 67%, resulting in achievement against the target performance
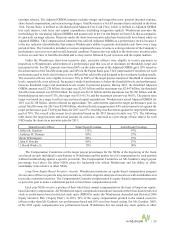
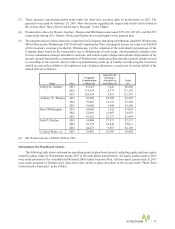
goal of 74%. The overall achievement level calculated based on the 2013 financial results was 72%. The following
table shows the target payouts and actual payouts (in each case, expressed as a percentage of base salary) for each
NEO under the short-term incentive plan for 2013:
Named Executive Officer Target Payout Percentage Actual Payout Percentage
Jeffery R. Gardner 135% 97%
Anthony W. Thomas 80% 57%
Brent Whittington 80% 57%
John P. Fletcher 80% 57%
J. David Works, Jr. 70% 50%
The Compensation Committee set the target payout percentages for the NEOs at the beginning of the fiscal
year based on such individual’s contributions to Windstream and the market level of compensation for such position
without benchmarking against a specific percentile. The Compensation Committee set Mr. Gardner’s target payout
percentage level above the other NEOs given his leadership role within Windstream and his ability to affect
stockholder value relative to other NEOs.
Long-Term Equity-Based Incentive Awards. Windstream maintains an equity-based compensation program
for executive officers to provide long-term incentives, to better align the interests of executives with stockholders and
to provide a retention incentive. The Compensation Committee implemented its equity-based compensation program
as part of its goal to make a substantial portion of total direct compensation at-risk.
Each year NEOs receive a portion of their total direct annual compensation in the form of long-term equity-
based incentive compensation. All Windstream equity compensation awards are issued as either time-based restricted
stock or performance-based restricted stock units (PBRSUs) under the Windstream Amended and Restated 2006
Equity Incentive Plan (“Equity Plan”). In 2013, 50% of the equity compensation granted to the named executive
officers (other than Mr. Gardner) was performance-based and 50% was time-based vesting. For Mr. Gardner, 100%
of his 2013 equity compensation was performance-based. Windstream has not issued any stock options or other