Windstream 2013 Annual Report Download - page 147
Download and view the complete annual report
Please find page 147 of the 2013 Windstream annual report below. You can navigate through the pages in the report by either clicking on the pages listed below, or by using the keyword search tool below to find specific information within the annual report.-
 1
1 -
2
-
3
-
4
-
5
-
6
-
7
-
8
-
9
-
10
-
11
-
12
-
13
-
14
-
15
-
16
-
17
-
18
-
19
-
20
-
21
-
22
-
23
-
24
-
25
-
26
-
27
-
28
-
29
-
30
-
31
-
32
-
33
-
34
-
35
-
36
-
37
-
38
-
39
-
40
-
41
-
42
-
43
-
44
-
45
-
46
-
47
-
48
-
49
-
50
-
51
-
52
-
53
-
54
-
55
-
56
-
57
-
58
-
59
-
60
-
61
-
62
-
63
-
64
-
65
-
66
-
67
-
68
-
69
-
70
-
71
-
72
-
73
-
74
-
75
-
76
-
77
-
78
-
79
-
80
-
81
-
82
-
83
-
84
-
85
-
86
-
87
-
88
-
89
-
90
-
91
-
92
-
93
-
94
-
95
-
96
-
97
-
98
-
99
-
100
-
101
-
102
-
103
-
104
-
105
-
106
-
107
-
108
-
109
-
110
-
111
-
112
-
113
-
114
-
115
-
116
-
117
-
118
-
119
-
120
-
121
-
122
-
123
-
124
-
125
-
126
-
127
-
128
-
129
-
130
-
131
-
132
-
133
-
134
-
135
-
136
-
 137
137 -
 138
138 -
 139
139 -
 140
140 -
 141
141 -
 142
142 -
 143
143 -
 144
144 -
 145
145 -
 146
146 -
 147
147 -
 148
148 -
 149
149 -
 150
150 -
 151
151 -
 152
152 -
 153
153 -
 154
154 -
 155
155 -
 156
156 -
 157
157 -
158
-
159
-
160
-
161
-
162
-
163
-
164
-
165
-
166
-
167
-
168
-
169
-
170
-
171
-
172
-
173
-
174
-
175
-
176
-
177
-
178
-
179
-
180
-
181
-
182
-
183
-
184
-
185
-
186
-
187
-
188
-
189
-
190
-
191
-
192
-
193
-
194
-
195
-
196
-
197
-
198
-
199
-
200
-
201
-
202
-
203
-
204
-
205
-
206
-
207
-
208
-
209
-
210
-
211
-
212
-
213
-
214
-
215
-
216
-
217
-
218
-
219
-
220
-
221
-
222
-
223
-
224
-
225
-
226
-
227
-
228
-
229
-
230
-
231
-
232
-
233
-
234
-
235
-
236
 |
 |

F-11
Selling, General and Administrative ("SG&A")
SG&A expenses result from sales and marketing efforts, advertising, IT support, costs associated with corporate and other
support functions, and professional fees. These expenses include salaries, wages and employee benefits not directly associated
with the provisioning of services.
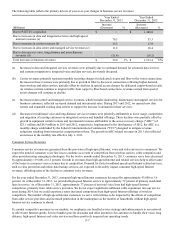
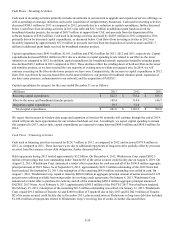
The following table reflects the primary drivers of year-over-year changes in SG&A expenses:
Year Ended
December 31, 2013 Year Ended
December 31, 2012
(Millions) Increase
(Decrease) % Increase
(Decrease) %
Due to PAETEC acquisition $ — $ 393.1
Due to changes in sales and marketing expenses (a) 22.5 (24.5)
Due to changes in other costs (4.6) 3.6
Due to changes in medical insurance (b) (13.9) 17.8
Due to decreases in pension and postretirement expense (c) (47.9)(24.6)
Total changes in SG&A $ (43.9) (5)% $ 365.4 61%
(a) The increase in sales and marketing in 2013 was due to additional compensation costs resulting from the expansion of
our business sales force, partially offset by lower advertising costs for the consumer channel and decreased consumer
sales expenses. The decrease in 2012 was due to lower compensation costs for the business channel and decreased
marketing and advertising expenses.
(b) The increase in medical insurance in 2012 was primarily due to increases in medical claims and related costs. The
subsequent decrease in 2013 was a result of cost management strategies implemented through changes to our medical
plans.
(c) Decrease in pension and postretirement expense in 2013 reflected the effects of an actuarial gain of $110.4 million
primarily attributable to an increase in the discount rate utilized to measure our pension obligations from 3.85 percent
in 2012 to 5.01 percent in 2013, of which $26.7 million was recorded to SG&A. In addition, we recognized
curtailment gains totaling $32.2 million in 2013 resulting from the elimination of medical and prescription subsidies
for certain active and retired participants, of which $8.1 million was recorded to SG&A. The decrease in 2012 was
primarily due to our pension plan assets performing better than expected, partially offset by the effects of decreasing
the discount rate from 4.64 percent in 2011 to 3.85 percent in 2012. See Note 8 to the consolidated financial statements
for additional information regarding our pension and postretirement benefit plans.
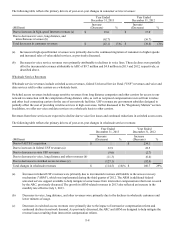
Depreciation and Amortization Expense
Depreciation and amortization expense includes the depreciation of property, plant and equipment and the amortization of
intangible assets.
The following table reflects the primary drivers of year-over-year changes in depreciation and amortization expense:
Year Ended
December 31, 2013 Year Ended
December 31, 2012
(Millions) Increase
(Decrease) % Increase
(Decrease) %
Due to depreciation of fixed assets acquired in PAETEC
acquisition $ — $ 183.9
Due to the amortization of intangible assets acquired in PAETEC
acquisition — 149.6
Non-acquisition related increases in depreciation expense (a) 94.7 144.3
Non-acquisition related decreases in amortization expense (b) (50.7) (28.4)
Total increases in depreciation and amortization expense $ 44.0 3% $ 449.4 53%