America Online 2011 Annual Report Download - page 32
Download and view the complete annual report
Please find page 32 of the 2011 America Online annual report below. You can navigate through the pages in the report by either clicking on the pages listed below, or by using the keyword search tool below to find specific information within the annual report.-
 1
1 -
2
-
3
-
4
-
5
-
6
-
7
-
8
-
9
-
10
-
11
-
12
-
13
-
14
-
15
-
16
-
17
-
18
-
19
-
20
-
21
-
 22
22 -
 23
23 -
 24
24 -
 25
25 -
 26
26 -
 27
27 -
 28
28 -
 29
29 -
 30
30 -
 31
31 -
 32
32 -
 33
33 -
 34
34 -
 35
35 -
 36
36 -
 37
37 -
 38
38 -
 39
39 -
 40
40 -
 41
41 -
 42
42 -
43
-
44
-
45
-
46
-
47
-
48
-
49
-
50
-
51
-
52
-
53
-
54
-
55
-
56
-
57
-
58
-
59
-
60
-
61
-
62
-
63
-
64
-
65
-
66
-
67
-
68
-
69
-
70
-
71
-
72
-
73
-
74
-
75
-
76
-
77
-
78
-
79
-
80
-
81
-
82
-
83
-
84
-
85
-
86
-
87
-
88
-
89
-
90
-
91
-
92
-
93
-
94
-
95
-
96
-
97
-
98
-
99
-
100
-
101
-
102
-
103
-
104
-
105
-
106
-
107
-
108
-
109
-
110
-
111
-
112
-
113
-
114
-
115
-
116
-
117
-
118
-
119
-
120
-
121
-
122
-
123
-
124
-
125
-
126
-
127
-
128
-
129
 |
 |
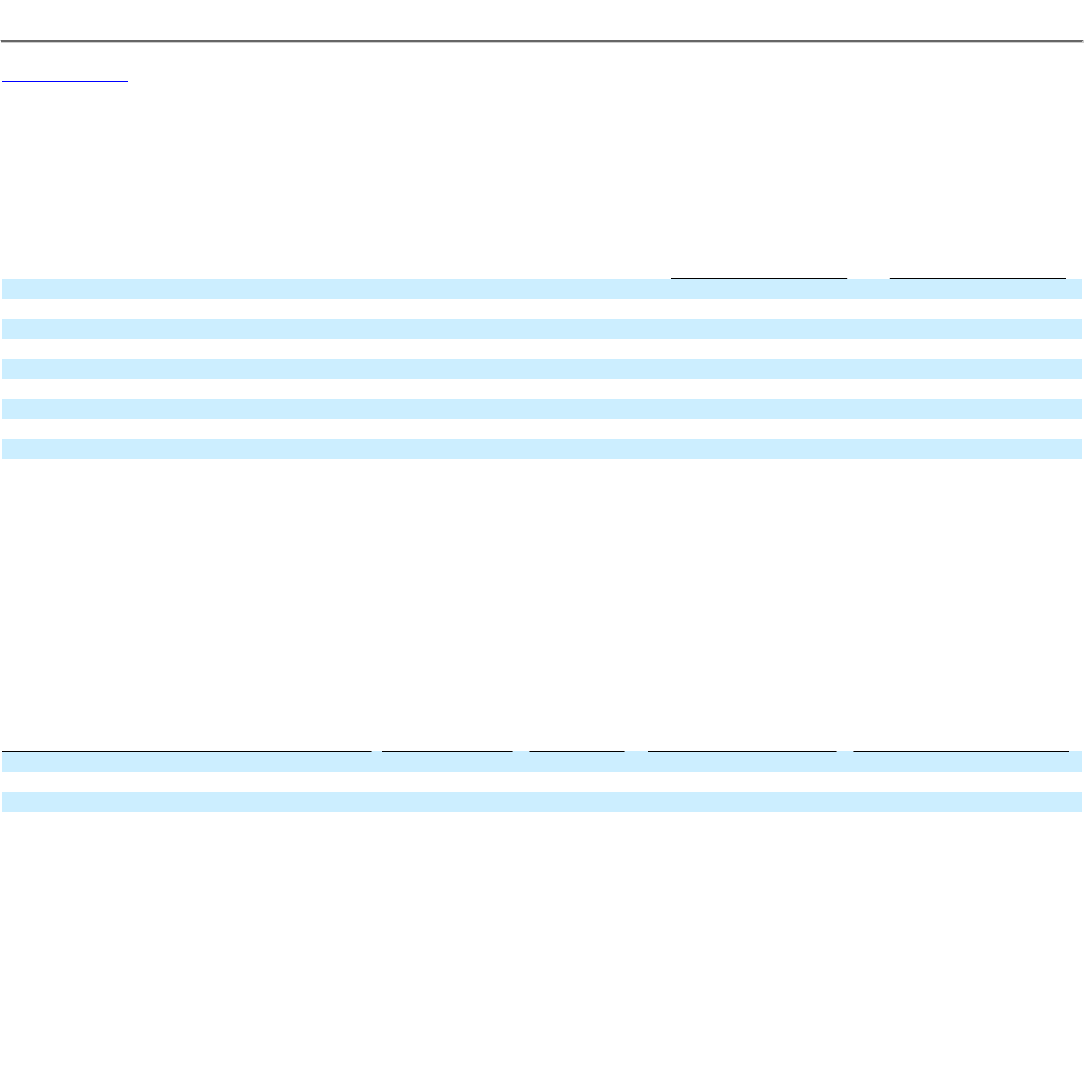
Table of Contents
PART II
ITEM 5. MARKET FOR REGISTRANT'S COMMON EQUITY, RELATED STOCKHOLDER MATTERS AND ISSUER PURCHASES OF
EQUITY SECURITIES
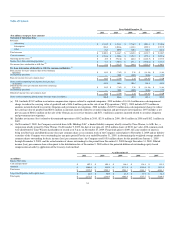
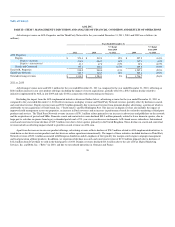
AOL's common stock is listed on the New York Stock Exchange (NYSE) under the symbol "AOL." The following table presents the quarterly high and
low sales prices for the common stock on the NYSE as reported for each period indicated:
High Low
2010 Quarters Ended:
March 31, 2010 $ 26.53 $ 23.23
June 30, 2010 29.45 19.61
September 30, 2010 25.56 19.80
December 31, 2010 27.65 23.48
2011 Quarters Ended:
March 31, 2011 $ 24.91 $ 18.51
June 30, 2011 22.47 18.44
September 30, 2011 20.83 10.06
December 31, 2011 15.82 11.17
As of February 17, 2012 there were approximately 18,700 holders of record of our common stock. Because many of our shares of common stock are
held by brokers and other institutions on behalf of stockholders, we are unable to estimate the total number of stockholders represented by these record
holders. The closing price of the common stock on the NYSE on February 17, 2012 was $18.73.
Stock Repurchases
The following is a summary of common shares repurchased by the Company under its stock repurchase program:
Period
Total Number
of Shares
Purchased
Average
Price Paid
per Share
Total Number of
Shares Purchased as
Part of Publicly
announced Plans or
Programs (a)
Approximate Dollar
Value of Shares that
May Yet Be Purchased
Under the Plans or
Programs (a)
October 1,—October 31, 2011 4,643,413 $ 13.03 4,643,413 $ 120,400,000
November 1,—November 30, 2011 1,615,900 $ 14.46 1,615,900 $ 97,000,000
December 1,—December 31. 2011 1,461,174 $ 14.00 1,461,174 $ 76,500,000
Total 7,720,487 $ 13.52 7,720,487 $ 76,500,000
(a) On August 11, 2011 the Company announced that its Board of Directors approved a stock repurchase program effective August 10, 2011, which
authorizes the Company to repurchase up to $250 million of its outstanding shares of common stock through August 2012. Repurchases are subject to
market conditions, share price and other factors. Repurchases have been and will be made in accordance with applicable securities laws in the open
market or in private transactions and may include derivative transactions, or pursuant to any trading plan adopted in accordance with Rule 10b5-1 of the
Securities and Exchange Commission. The repurchase program may be suspended or discontinued at any time. The approximate dollar value of shares
that may yet be repurchased under the program excludes commissions and other fees paid in relation to repurchases through December 31, 2011.
Dividend Policy
We have not paid cash dividends and we do not anticipate the payment of cash dividends on our common stock in the immediate future.
28