America Online 2011 Annual Report Download - page 44
Download and view the complete annual report
Please find page 44 of the 2011 America Online annual report below. You can navigate through the pages in the report by either clicking on the pages listed below, or by using the keyword search tool below to find specific information within the annual report.-
 1
1 -
2
-
3
-
4
-
5
-
6
-
7
-
8
-
9
-
10
-
11
-
12
-
13
-
14
-
15
-
16
-
17
-
18
-
19
-
20
-
21
-
22
-
23
-
24
-
25
-
26
-
27
-
28
-
29
-
30
-
31
-
32
-
33
-
 34
34 -
 35
35 -
 36
36 -
 37
37 -
 38
38 -
 39
39 -
 40
40 -
 41
41 -
 42
42 -
 43
43 -
 44
44 -
 45
45 -
 46
46 -
 47
47 -
 48
48 -
 49
49 -
 50
50 -
 51
51 -
 52
52 -
 53
53 -
 54
54 -
55
-
56
-
57
-
58
-
59
-
60
-
61
-
62
-
63
-
64
-
65
-
66
-
67
-
68
-
69
-
70
-
71
-
72
-
73
-
74
-
75
-
76
-
77
-
78
-
79
-
80
-
81
-
82
-
83
-
84
-
85
-
86
-
87
-
88
-
89
-
90
-
91
-
92
-
93
-
94
-
95
-
96
-
97
-
98
-
99
-
100
-
101
-
102
-
103
-
104
-
105
-
106
-
107
-
108
-
109
-
110
-
111
-
112
-
113
-
114
-
115
-
116
-
117
-
118
-
119
-
120
-
121
-
122
-
123
-
124
-
125
-
126
-
127
-
128
-
129
 |
 |

Table of Contents
AOL INC.
PART II—ITEM 7. MANAGEMENT'S DISCUSSION AND ANALYSIS OF FINANCIAL CONDITION AND RESULTS OF OPERATIONS
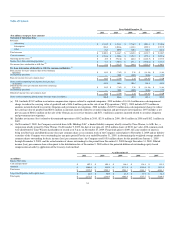
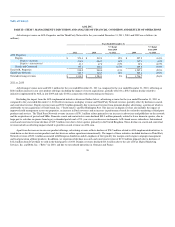
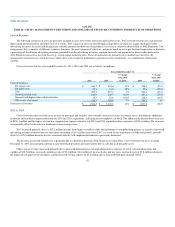
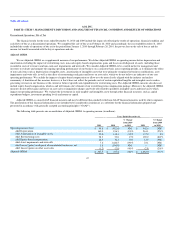
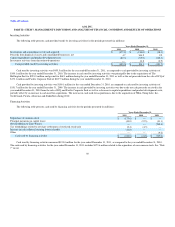
subscribers declined by 20% between December 31, 2010 and December 31, 2011. To a lesser extent, the decline in subscription revenues was due to a $0.45
decline in domestic average monthly revenue per AOL-brand access subscriber ("ARPU") including the nominal impacts of both the migration of customers
to an access subscription plan and the simplified pricing structure discussed further below. In 2011, we resolved the final open dispute with the counterparty
to whom we sold our German access business in 2007, resulting in a $3.1 million favorable impact, which compared to a $5.4 million favorable impact in
prior year.
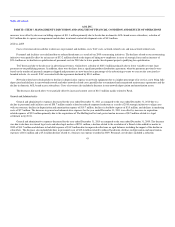
Subscription revenues declined 26% for the year ended December 31, 2010 as compared to the year ended December 31, 2009. The decline was due to
an approximate 23% decrease in the number of domestic AOL-brand access subscribers between December 31, 2009 and December 31, 2010. Also
contributing to the decline in subscription revenues was a $0.30 decline in ARPU. Partially offsetting these declines was $5.4 million related to the favorable
resolution of a portion of a dispute with the counterparty to whom we sold our German access business in 2007.
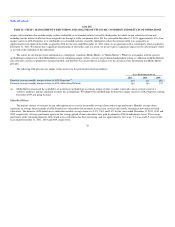
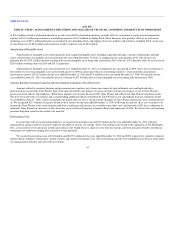
The number of domestic AOL-brand access subscribers was 3.3 million, 3.9 million and 5.0 million at December 31, 2011, 2010 and 2009,
respectively. ARPU was $17.71, $18.16 and $18.46 for the years ended December 31, 2011, 2010 and 2009, respectively. We include in our subscriber
numbers individuals, households and entities that have provided billing information and completed the registration process sufficiently to allow for an initial
log-on to the AOL access service. Individuals who have registered for our free offerings, including subscribers who have migrated from paid subscription
plans, are not included in the AOL-brand access subscriber numbers presented above. Subscribers to our subscription access service contribute to our ability
to generate advertising revenues.
During the third quarter of 2011, certain individuals who were not previously customers of an access subscription plan (and therefore not previously
included in our count of AOL-brand access subscribers) were migrated to a higher priced plan that includes a number of additional features including access
services. As a result, our domestic AOL-brand access subscribers at December 31, 2011 include approximately 200,000 subscribers related to this migration.
Late in the third quarter of 2011, AOL began a process to simplify the number of price plans and service packages available to AOL-brand access subscribers.
As a result, we provided additional features and services to approximately 1.4 million subscribers with a simplified pricing structure.
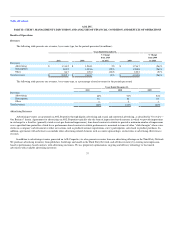
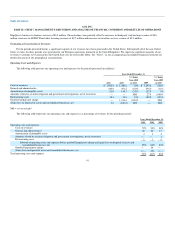
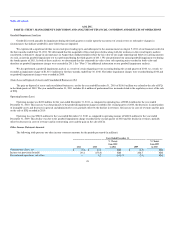
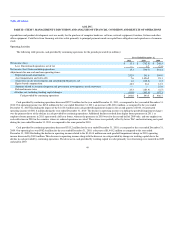
Other Revenues
Other revenues consist primarily of fees associated with our mobile e-mail and instant messaging functionality from mobile carriers, licensing revenues
from third-party customers of MapQuest's business-to-business services and licensing revenues from licensing our proprietary ad serving technology to third
parties through our subsidiary, ADTECH. In addition, other revenue also includes revenue from ticket sales related to technology events hosted by
TechCrunch.
Other revenues decreased 22% for the year ended December 31, 2011, as compared to the year ended December 31, 2010, due primarily to a decrease
in revenues from our mobile messaging services of $21.3 million as mobile carriers continue to move away from paying on a per message basis, a decline in
third party web hosting revenues of $4.1 million, a decline in licensing revenues from MapQuest's business-to-business services of $2.1 million and a
decrease in transition services revenue of $2.0 million. These declines were partially offset by increases in TechCrunch revenue of $3.4 million and an
increase in ADTECH and other licensing revenues of $2.4 million.
Other revenues decreased 9% for the year ended December 31, 2010, as compared to the year ended December 31, 2009, due primarily to lower
revenues from our mobile messaging services of $17.3 million as mobile carriers began to move away from paying on a per message basis and a decline in
licensing revenues from
40