America Online 2011 Annual Report Download - page 53
Download and view the complete annual report
Please find page 53 of the 2011 America Online annual report below. You can navigate through the pages in the report by either clicking on the pages listed below, or by using the keyword search tool below to find specific information within the annual report.-
 1
1 -
2
-
3
-
4
-
5
-
6
-
7
-
8
-
9
-
10
-
11
-
12
-
13
-
14
-
15
-
16
-
17
-
18
-
19
-
20
-
21
-
22
-
23
-
24
-
25
-
26
-
27
-
28
-
29
-
30
-
31
-
32
-
33
-
34
-
35
-
36
-
37
-
38
-
39
-
40
-
41
-
42
-
 43
43 -
 44
44 -
 45
45 -
 46
46 -
 47
47 -
 48
48 -
 49
49 -
 50
50 -
 51
51 -
 52
52 -
 53
53 -
 54
54 -
 55
55 -
 56
56 -
 57
57 -
 58
58 -
 59
59 -
 60
60 -
 61
61 -
 62
62 -
 63
63 -
64
-
65
-
66
-
67
-
68
-
69
-
70
-
71
-
72
-
73
-
74
-
75
-
76
-
77
-
78
-
79
-
80
-
81
-
82
-
83
-
84
-
85
-
86
-
87
-
88
-
89
-
90
-
91
-
92
-
93
-
94
-
95
-
96
-
97
-
98
-
99
-
100
-
101
-
102
-
103
-
104
-
105
-
106
-
107
-
108
-
109
-
110
-
111
-
112
-
113
-
114
-
115
-
116
-
117
-
118
-
119
-
120
-
121
-
122
-
123
-
124
-
125
-
126
-
127
-
128
-
129
 |
 |
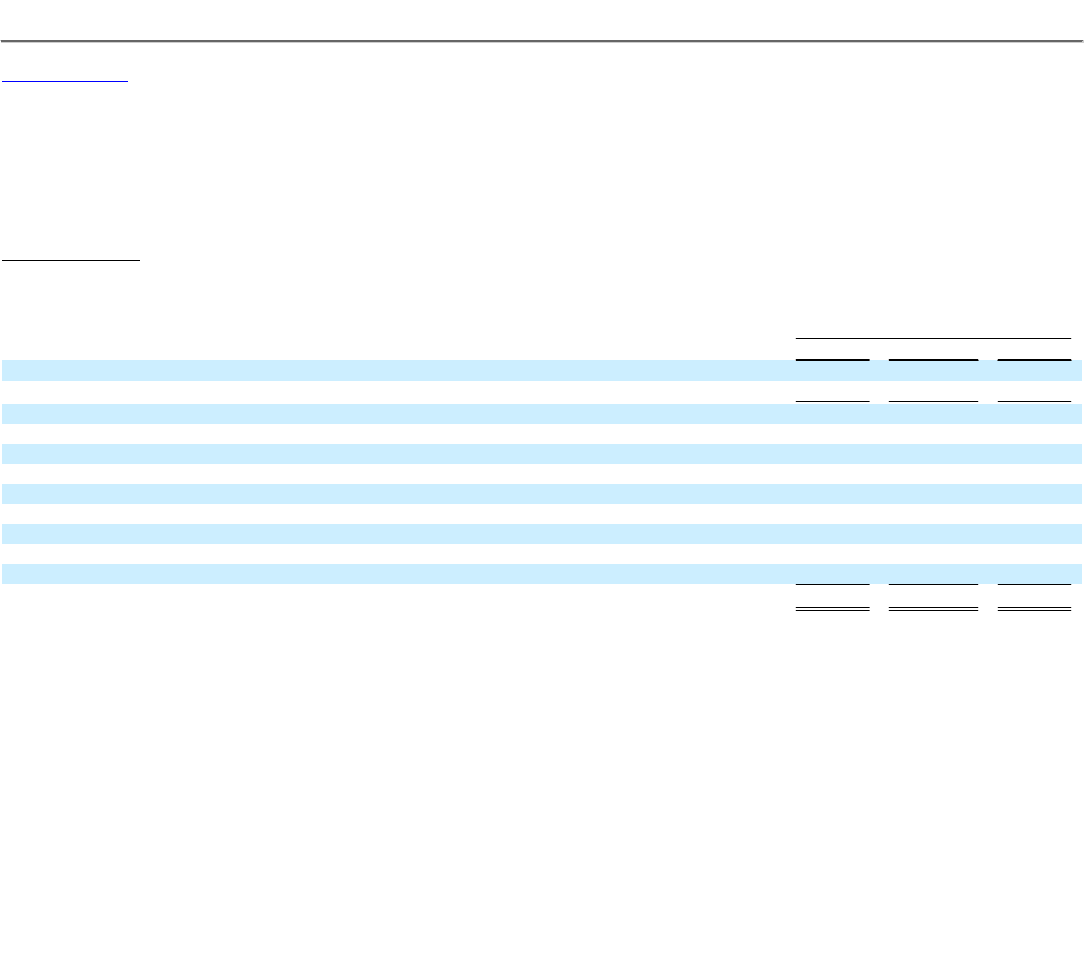
Table of Contents
AOL INC.
PART II—ITEM 7. MANAGEMENT'S DISCUSSION AND ANALYSIS OF FINANCIAL CONDITION AND RESULTS OF OPERATIONS
expenditures and product development costs are mainly for the purchase of computer hardware, software, network equipment, furniture, fixtures and other
office equipment. Cash flows from financing activities relate primarily to principal payments made on capital lease obligations and repurchases of common
stock.
Operating Activities
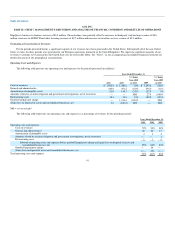
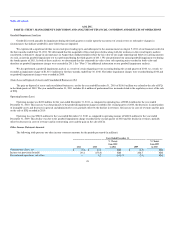
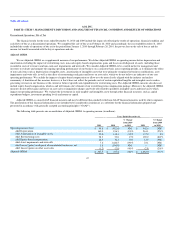
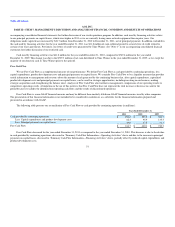
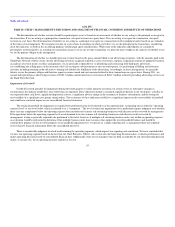
The following table presents cash provided by continuing operations for the periods presented (in millions):
Years Ended December 31,
2011 2010 2009
Net income (loss) $ 13.1 $ (782.5) $ 248.5
Less: Discontinued operations, net of tax — 8.2 (2.9)
Net income (loss) from continuing operations 13.1 (790.7) 251.4
Adjustments for non-cash and non-operating items:
Depreciation and amortization 252.9 341.6 399.0
Asset impairments and write-offs 7.6 1,426.5 23.1
(Gain) loss on sale of investments and consolidated businesses, net 1.6 (132.5) 0.2
Equity-based compensation 42.5 36.1 12.5
Amounts related to securities litigation and government investigations, net of recoveries — — 27.9
Deferred income taxes 23.3 (183.9) (4.7)
All other, net, including working capital changes (45.0) (103.6) 197.3
Cash provided by continuing operations $ 296.0 $ 593.5 $ 906.7
Cash provided by continuing operations decreased $297.5 million for the year ended December 31, 2011, as compared to the year ended December 31,
2010. Our operating income was $45.8 million for the year ended December 31, 2011, an increase of $1,028.4 million, as compared to the year ended
December 31, 2010. Excluding the impact of the $1,414.4 million non-cash goodwill impairment charge in the second quarter of 2010, we generated
operating income of $431.8 million during the year ended December 31, 2010. The decline in operating income (excluding the goodwill impairment charge)
was the primary driver of the decline in cash provided by continuing operations. Additional declines resulted from higher bonus payments in 2011, as
employee bonus payments in 2011 represented a full year bonus, whereas the payments in 2010 were for the second half of 2009 only, and our emphasis on
cash collections in 2010 in the countries where we reduced operations or exited. These items were partially offset by lower TAC and restructuring costs paid
during the year ended December 31, 2011 as compared to the same period in 2010.
Cash provided by continuing operations decreased $313.2 million for the year ended December 31, 2010, as compared to the year ended December 31,
2009. Our operating loss was $982.6 million for the year ended December 31, 2010, a decrease of $1,445.2 million as compared to the year ended
December 31, 2009. Excluding the decline in operating income related to the $1,414.4 million non-cash goodwill impairment charge in 2010, operating
income decreased by $30.8 million. This decrease in operating income along with the decrease in cash provided by changes in working capital drove the
decline in cash provided by continuing operations. The decrease in cash provided by working capital was due primarily to restructuring costs incurred in 2009
and paid in 2010.
49