America Online 2011 Annual Report Download - page 43
Download and view the complete annual report
Please find page 43 of the 2011 America Online annual report below. You can navigate through the pages in the report by either clicking on the pages listed below, or by using the keyword search tool below to find specific information within the annual report.-
 1
1 -
2
-
3
-
4
-
5
-
6
-
7
-
8
-
9
-
10
-
11
-
12
-
13
-
14
-
15
-
16
-
17
-
18
-
19
-
20
-
21
-
22
-
23
-
24
-
25
-
26
-
27
-
28
-
29
-
30
-
31
-
32
-
 33
33 -
 34
34 -
 35
35 -
 36
36 -
 37
37 -
 38
38 -
 39
39 -
 40
40 -
 41
41 -
 42
42 -
 43
43 -
 44
44 -
 45
45 -
 46
46 -
 47
47 -
 48
48 -
 49
49 -
 50
50 -
 51
51 -
 52
52 -
 53
53 -
54
-
55
-
56
-
57
-
58
-
59
-
60
-
61
-
62
-
63
-
64
-
65
-
66
-
67
-
68
-
69
-
70
-
71
-
72
-
73
-
74
-
75
-
76
-
77
-
78
-
79
-
80
-
81
-
82
-
83
-
84
-
85
-
86
-
87
-
88
-
89
-
90
-
91
-
92
-
93
-
94
-
95
-
96
-
97
-
98
-
99
-
100
-
101
-
102
-
103
-
104
-
105
-
106
-
107
-
108
-
109
-
110
-
111
-
112
-
113
-
114
-
115
-
116
-
117
-
118
-
119
-
120
-
121
-
122
-
123
-
124
-
125
-
126
-
127
-
128
-
129
 |
 |

Table of Contents
AOL INC.
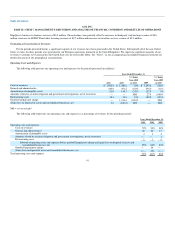
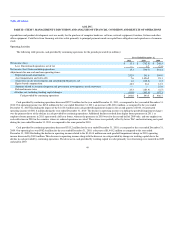
PART II—ITEM 7. MANAGEMENT'S DISCUSSION AND ANALYSIS OF FINANCIAL CONDITION AND RESULTS OF OPERATIONS
2010 vs. 2009
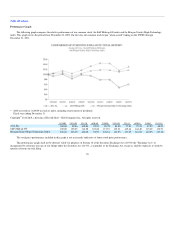
Advertising revenues decreased $452.6 million for the year ended December 31, 2010 as compared to the year ended December 31, 2009. Of this
decline, $268.2 million was related to AOL-implemented initiatives and the remaining $184.4 million decline was related to our core product offerings.
AOL-implemented initiatives to wind down or shut down certain products and shut down or reduce operations internationally resulted in declines of
$268.2 million for the year ended December 31, 2010 as compared to the year ended December 31, 2009. The most significant impact from these initiatives
drove declines in Third Party Network revenue of $177.1 million associated with European shutdowns and de-emphasis of the typically low margin search
engine campaign management and lead generation affiliate products. In addition, we experienced declines in search and contextual revenue of $54.2 million,
primarily due to the de-emphasis of our contextual products, fewer queries in Germany and France where we have reduced operations and declines of $14.3
million from ICQ which we sold in the third quarter of 2010. International display revenues declined by $36.9 million related to our reduced operations in
Germany and France and the sale of Bebo and ICQ in 2010.
Apart from the impacts of the AOL-implemented initiatives, advertising revenue reflects further declines in search and contextual, display and Third
Party Network revenue. Search and contextual revenue for the year ended December 31, 2010 declined $127.6 million as compared to the year ended
December 31, 2009. Of this decline, $93.7 million reflects the impact of fewer domestic search queries on AOL Properties, related primarily to a 23% year-
over-year decrease in domestic AOL-brand access subscribers as well as lower traffic on AOL Properties. The search and contextual revenue declines also
include international declines of $33.9 million due to fewer queries primarily in the United Kingdom. Domestic display revenue declines of $45.1 million
reflect a slight decline in premium inventory sales as well as the impact of less inventory from AOL Properties being monetized through the Third Party
Network, resulting primarily from our efforts to improve the user experience. Premium inventory sales declines reflect the impact on sales of a salesforce
reorganization in the first quarter of 2010, which resulted in subsequent quarters beginning with a significantly smaller sales pipeline. Domestic display
revenue declines were partially offset by approximately $2.0 million related to acquisitions made in 2010. Third Party Network declines of $10.9 million
reflect a reduction in sales due to increased competition at Ad.com and a reduction in contextual advertising. These Third Party Network declines were
partially offset by an increase of $2.3 million related to acquisitions made in 2010.
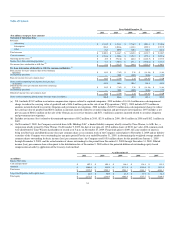
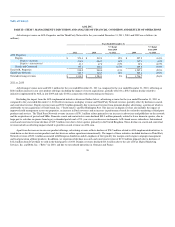
Revenues Associated with Google
For all periods presented in this Annual Report, we have had a contractual relationship with Google whereby we generate revenues through paid text-
based search and contextual advertising on AOL Properties provided by Google, which represent a significant percentage of the advertising revenues
generated by AOL Properties. For the years ended December 31, 2011, 2010 and 2009, the revenues associated with the Google relationship (substantially all
of which were search and contextual revenues generated on AOL Properties) were $335.3 million, $398.4 million and $556.7 million, respectively.
Subscription Revenues
Subscription revenues declined 22% for the year ended December 31, 2011 as compared to the year ended December 31, 2010. The decline was due to
an approximate 15% decrease in the number of domestic AOL-brand access subscribers between December 31, 2010 and December 31, 2011. Excluding the
migration of customers to an access subscription plan in the third quarter of 2011 discussed further below, our domestic AOL-brand access
39