America Online 2011 Annual Report Download - page 87
Download and view the complete annual report
Please find page 87 of the 2011 America Online annual report below. You can navigate through the pages in the report by either clicking on the pages listed below, or by using the keyword search tool below to find specific information within the annual report.-
 1
1 -
2
-
3
-
4
-
5
-
6
-
7
-
8
-
9
-
10
-
11
-
12
-
13
-
14
-
15
-
16
-
17
-
18
-
19
-
20
-
21
-
22
-
23
-
24
-
25
-
26
-
27
-
28
-
29
-
30
-
31
-
32
-
33
-
34
-
35
-
36
-
37
-
38
-
39
-
40
-
41
-
42
-
43
-
44
-
45
-
46
-
47
-
48
-
49
-
50
-
51
-
52
-
53
-
54
-
55
-
56
-
57
-
58
-
59
-
60
-
61
-
62
-
63
-
64
-
65
-
66
-
67
-
68
-
69
-
70
-
71
-
72
-
73
-
74
-
75
-
76
-
 77
77 -
 78
78 -
 79
79 -
 80
80 -
 81
81 -
 82
82 -
 83
83 -
 84
84 -
 85
85 -
 86
86 -
 87
87 -
 88
88 -
 89
89 -
 90
90 -
 91
91 -
 92
92 -
 93
93 -
 94
94 -
 95
95 -
 96
96 -
 97
97 -
98
-
99
-
100
-
101
-
102
-
103
-
104
-
105
-
106
-
107
-
108
-
109
-
110
-
111
-
112
-
113
-
114
-
115
-
116
-
117
-
118
-
119
-
120
-
121
-
122
-
123
-
124
-
125
-
126
-
127
-
128
-
129
 |
 |

Table of Contents
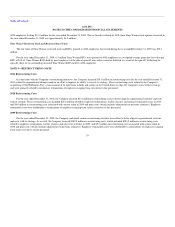
AOL INC.
NOTES TO THE CONSOLIDATED FINANCIAL STATEMENTS
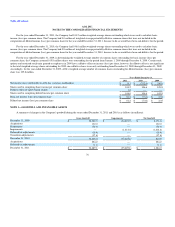
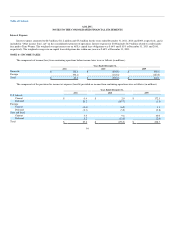
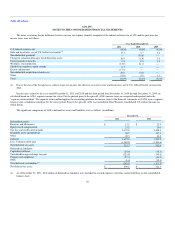
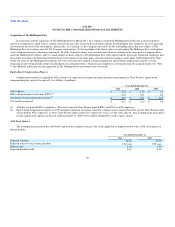
Summary of Discontinued Operations
There were no discontinued operations in 2011. Discontinued operations for the years ended December 31, 2010 and 2009 reflect the financial
condition, results of operations and cash flows of buy.at. The consolidated statement of operations for the year ended December 31, 2010 includes the results
of operations of buy.at for the period from January 1, 2010 through the sale date of February 26, 2010, the pre-tax loss on the sale of buy.at and the income
tax benefit associated with the capital loss generated by the buy.at sale. Financial data for discontinued operations for the years ended December 31, 2010 and
2009 is as follows (in millions):
Years Ended December 31,
2010 2009
Total revenues $ 2.0 $ 11.6
Pre-tax loss (before loss on sale of business) (0.5) (4.9)
Pre-tax loss on sale of business (18.9) —
Income tax benefit 27.6 2.0
Net income (loss) attributable to AOL Inc. $ 8.2 $ (2.9)
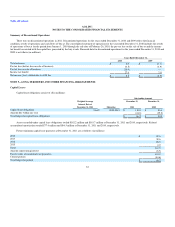
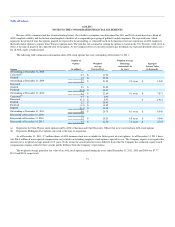
NOTE 5—LONG-TERM DEBT AND OTHER FINANCING ARRANGEMENTS
Capital Leases
Capital lease obligations consist of ($ in millions):
Weighted Average
Interest Rate at
December 31, 2011
Outstanding Amount
Maturities
December 31,
2011
December 31,
2010
Capital lease obligations 5.64% 2012-2015 $ 110.8 $ 86.1
Amount due within one year (44.6) (35.2)
Total long-term capital lease obligations $ 66.2 $ 50.9
Assets recorded under capital lease obligations totaled $182.2 million and $163.7 million at December 31, 2011 and 2010, respectively. Related
accumulated amortization totaled $77.4 million and $84.5 million at December 31, 2011 and 2010, respectively.
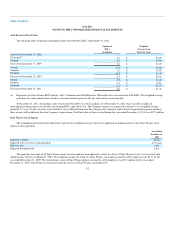
Future minimum capital lease payments at December 31, 2011 are as follows (in millions):
2012 $ 49.6
2013 39.6
2014 26.3
2015 4.0
Total 119.5
Amount representing interest (8.7)
Present value of minimum lease payments 110.8
Current portion (44.6)
Total long-term portion $ 66.2
83