America Online 2011 Annual Report Download - page 95
Download and view the complete annual report
Please find page 95 of the 2011 America Online annual report below. You can navigate through the pages in the report by either clicking on the pages listed below, or by using the keyword search tool below to find specific information within the annual report.-
 1
1 -
2
-
3
-
4
-
5
-
6
-
7
-
8
-
9
-
10
-
11
-
12
-
13
-
14
-
15
-
16
-
17
-
18
-
19
-
20
-
21
-
22
-
23
-
24
-
25
-
26
-
27
-
28
-
29
-
30
-
31
-
32
-
33
-
34
-
35
-
36
-
37
-
38
-
39
-
40
-
41
-
42
-
43
-
44
-
45
-
46
-
47
-
48
-
49
-
50
-
51
-
52
-
53
-
54
-
55
-
56
-
57
-
58
-
59
-
60
-
61
-
62
-
63
-
64
-
65
-
66
-
67
-
68
-
69
-
70
-
71
-
72
-
73
-
74
-
75
-
76
-
77
-
78
-
79
-
80
-
81
-
82
-
83
-
84
-
 85
85 -
 86
86 -
 87
87 -
 88
88 -
 89
89 -
 90
90 -
 91
91 -
 92
92 -
 93
93 -
 94
94 -
 95
95 -
 96
96 -
 97
97 -
 98
98 -
 99
99 -
 100
100 -
 101
101 -
 102
102 -
 103
103 -
 104
104 -
 105
105 -
106
-
107
-
108
-
109
-
110
-
111
-
112
-
113
-
114
-
115
-
116
-
117
-
118
-
119
-
120
-
121
-
122
-
123
-
124
-
125
-
126
-
127
-
128
-
129
 |
 |
Table of Contents
AOL INC.
NOTES TO THE CONSOLIDATED FINANCIAL STATEMENTS
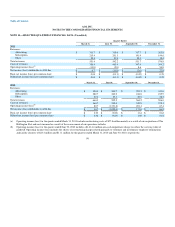
Because AOL's common stock has a limited trading history, the volatility assumption was determined for 2011 and 2010 awards based on a blend of
AOL's implied volatility and the historical and implied volatilities of a comparable peer group of publicly traded companies. The expected term, which
represents the period of time that options granted are expected to be outstanding, is estimated based on the historical exercise experience of AOL employees
that held similar options to acquire Time Warner common stock. The risk-free rate assumed in valuing the options is based on the U.S. Treasury yield curve in
effect at the time of grant for the expected term of the option. As the Company does not currently intend to pay dividends, the expected dividend yield is zero
for all AOL equity awards granted.
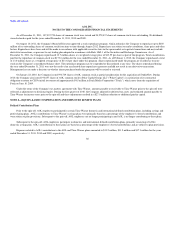
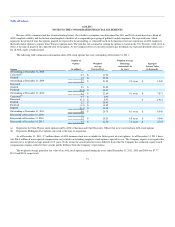
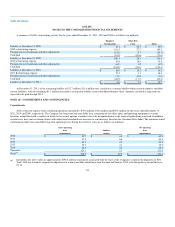
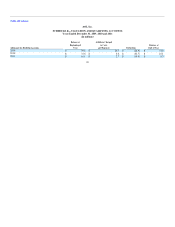
The following table summarizes information about AOL stock options that were outstanding at December 31, 2011:
Options
Number of
Options
(in millions)
Weighted-
Average
Exercise Price
Weighted-Average
Remaining
Contractual Life
(in years)
Aggregate
Intrinsic Value
(in thousands)
Outstanding at December 31, 2008 —
Converted(a) 0.5 $ 11.90
Granted 3.2 $ 23.28
Outstanding at December 31, 2009 3.7 $ 21.85 9.9 years $ 1,549
Exercised —
Granted 2.9 $ 23.85
Forfeited (0.4) $ 23.33
Outstanding at December 31, 2010 6.2 $ 22.69 9.1 years $ 7,871
Converted(b) 0.7 $ 2.92
Exercised (0.1) $ 2.93 $ 1,912
Granted 3.2 $ 20.41
Forfeited (1.3) $ 19.85
Expired (0.1) $ 23.34
Outstanding at December 31, 2011 8.6 $ 20.75 8.1 years $ 6,548
Exercisable at December 31, 2009 —
Exercisable at December 31, 2010 1.7 $ 20.25 8.8 years $ 5,940
Exercisable at December 31, 2011 3.7 $ 21.50 7.2 years $ 2,727
(a) Represents the Time Warner stock options held by AOL's Chairman and Chief Executive Officer that were converted into AOL stock options.
(b) Represents Huffington Post options converted at the time of acquisition.
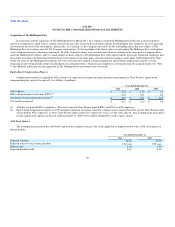
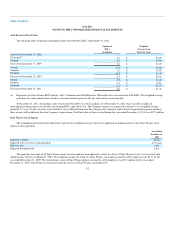
As of December 31, 2011, 4.7 million shares of AOL common stock were available for future grants of stock options. As of December 31, 2011, there
was $36.8 million of unrecognized compensation cost related to outstanding employee stock options expected to vest. The Company expects to recognize this
amount over a weighted-average period of 2.5 years. To the extent the actual forfeiture rate is different from what the Company has estimated, equity-based
compensation expense related to these awards will be different from the Company's expectations.
The weighted-average grant date fair value of an AOL stock option granted during the years ended December 31, 2011, 2010 and 2009 was $7.77,
$9.41 and $9.94, respectively.
91