America Online 2011 Annual Report Download - page 46
Download and view the complete annual report
Please find page 46 of the 2011 America Online annual report below. You can navigate through the pages in the report by either clicking on the pages listed below, or by using the keyword search tool below to find specific information within the annual report.-
 1
1 -
2
-
3
-
4
-
5
-
6
-
7
-
8
-
9
-
10
-
11
-
12
-
13
-
14
-
15
-
16
-
17
-
18
-
19
-
20
-
21
-
22
-
23
-
24
-
25
-
26
-
27
-
28
-
29
-
30
-
31
-
32
-
33
-
34
-
35
-
 36
36 -
 37
37 -
 38
38 -
 39
39 -
 40
40 -
 41
41 -
 42
42 -
 43
43 -
 44
44 -
 45
45 -
 46
46 -
 47
47 -
 48
48 -
 49
49 -
 50
50 -
 51
51 -
 52
52 -
 53
53 -
 54
54 -
 55
55 -
 56
56 -
57
-
58
-
59
-
60
-
61
-
62
-
63
-
64
-
65
-
66
-
67
-
68
-
69
-
70
-
71
-
72
-
73
-
74
-
75
-
76
-
77
-
78
-
79
-
80
-
81
-
82
-
83
-
84
-
85
-
86
-
87
-
88
-
89
-
90
-
91
-
92
-
93
-
94
-
95
-
96
-
97
-
98
-
99
-
100
-
101
-
102
-
103
-
104
-
105
-
106
-
107
-
108
-
109
-
110
-
111
-
112
-
113
-
114
-
115
-
116
-
117
-
118
-
119
-
120
-
121
-
122
-
123
-
124
-
125
-
126
-
127
-
128
-
129
 |
 |
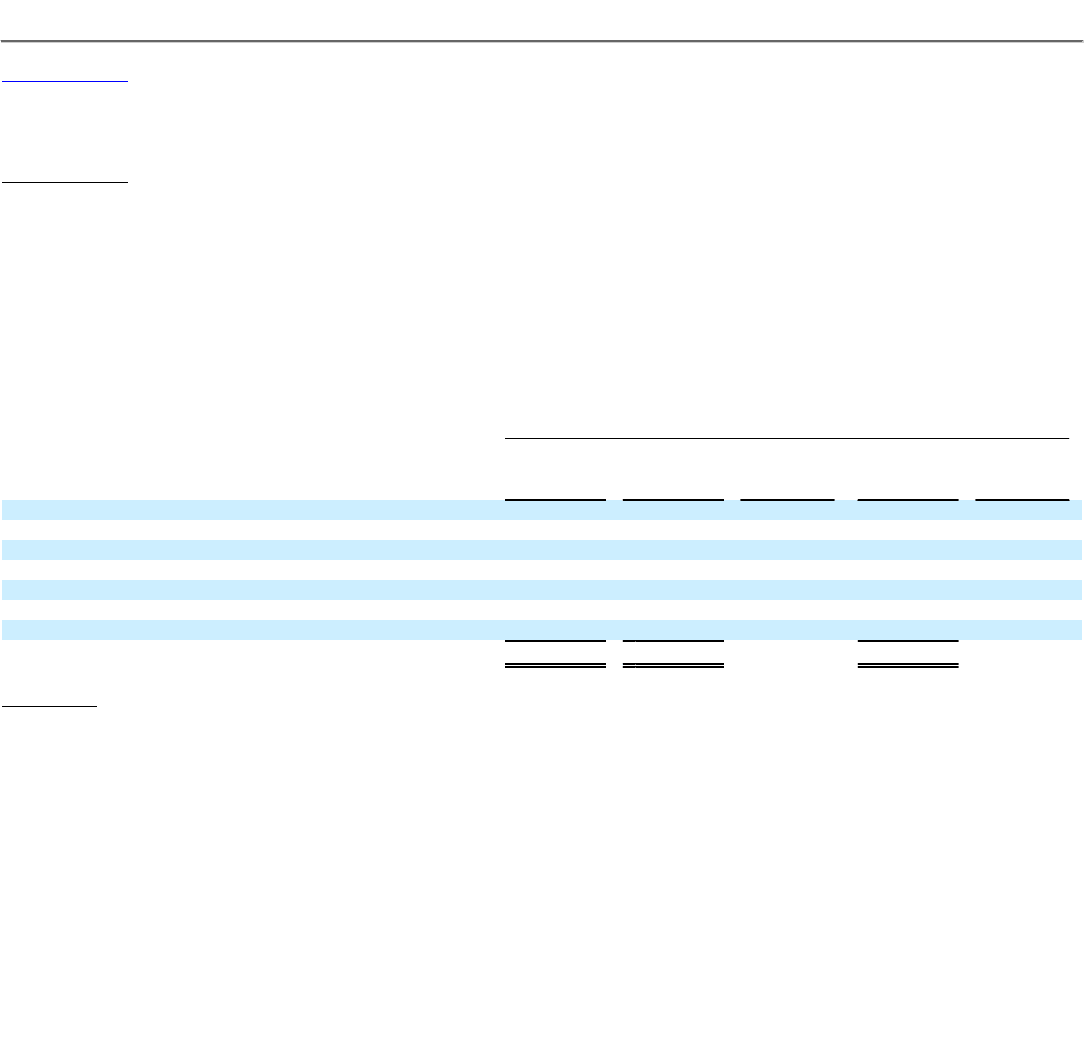
Table of Contents
AOL INC.
PART II—ITEM 7. MANAGEMENT'S DISCUSSION AND ANALYSIS OF FINANCIAL CONDITION AND RESULTS OF OPERATIONS
Costs of Revenues
The following categories of costs are generally included in costs of revenues: personnel and facilities costs, TAC, network-related costs, non-network
depreciation and amortization and other costs of revenues. TAC consists of costs incurred through arrangements in which we acquire third-party online
advertising inventory for resale and arrangements whereby partners distribute our free products or services or otherwise direct traffic to AOL Properties. TAC
arrangements have a number of different economic structures, the most common of which are: payments based on a cost per thousand impressions or based on
a percentage of the ultimate advertising revenues generated from the advertising inventory acquired for resale and payments for direct traffic delivered to
AOL Properties priced on a per click basis (e.g., search engine marketing fees). These arrangements are primarily on a variable basis; however, the
arrangements can also be on a fixed-fee basis, which often carry reciprocal performance guarantees by the counterparty, or a combination of fixed and
variable.
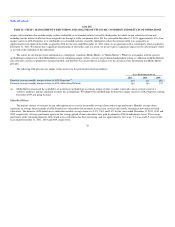
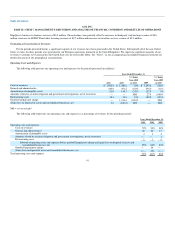
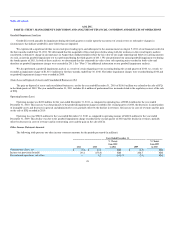
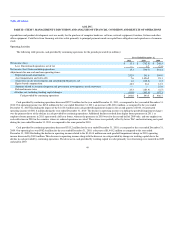
Costs of revenues for the years ended December 31, 2011, 2010 and 2009 are as follows (in millions):
Years Ended December 31,
2011 2010
% Change
from 2010
to 2011 2009
% Change
from 2009
to 2010
Costs of revenues:
Personnel costs $ 646.2 $ 494.6 31% $ 598.1 (17)%
Facilities costs 57.3 41.5 38% 52.6 (21)%
TAC 305.5 297.7 3% 566.8 (47)%
Network-related costs 186.6 206.7 (10)% 283.2 (27)%
Non-network depreciation and amortization 70.5 83.6 (16)% 108.3 (23)%
Other costs of revenues 318.3 296.5 7% 284.2 4%
Total costs of revenues $ 1,584.4 $ 1,420.6 12% $ 1,893.2 (25)%
2011 vs. 2010
Costs of revenues increased due to an increase in personnel and facilities costs related to increases in areas of strategic focus, including the additional
headcount and retention compensation from our 2010 and 2011 acquisitions, and hiring of new employees in Patch. The additional headcount drove increases
of $156.4 million and the impact of retention compensation expense related to our 2010 and 2011 acquisitions drove increases of $29.4 million. The increases
were partially offset by decreases in headcount in non-strategic areas.
TAC increased primarily due to a $32.3 million increase from higher variable revenue share payments to our publishing partners as a result of increased
advertising revenues related to our core operations (including a $14.9 million increase in TAC as a result of our acquisitions of 5Min and goviral), partially
offset by a $23.8 million decrease in costs associated with the AOL-implemented initiatives previously discussed.
The decrease in network-related costs is primarily due to a decline in domestic AOL-brand access subscribers. Cost of revenues for the year ended
December 31, 2011 also included a decline in non-network depreciation and amortization due to a decline in depreciable assets.
Other costs of revenues increased primarily due to increased promotional events and administrative expenses of travel, telecommunications and
supplies of $18.5 million, increased consulting costs of $9.4 million, $4.6 million of increased sales and use taxes, increased costs of $3.8 million relating to
the launch of new paid services products, and increased ad serving expense of $3.8 million due to increased third party demand. These
42