America Online 2011 Annual Report Download - page 33
Download and view the complete annual report
Please find page 33 of the 2011 America Online annual report below. You can navigate through the pages in the report by either clicking on the pages listed below, or by using the keyword search tool below to find specific information within the annual report.-
 1
1 -
2
-
3
-
4
-
5
-
6
-
7
-
8
-
9
-
10
-
11
-
12
-
13
-
14
-
15
-
16
-
17
-
18
-
19
-
20
-
21
-
22
-
 23
23 -
 24
24 -
 25
25 -
 26
26 -
 27
27 -
 28
28 -
 29
29 -
 30
30 -
 31
31 -
 32
32 -
 33
33 -
 34
34 -
 35
35 -
 36
36 -
 37
37 -
 38
38 -
 39
39 -
 40
40 -
 41
41 -
 42
42 -
 43
43 -
44
-
45
-
46
-
47
-
48
-
49
-
50
-
51
-
52
-
53
-
54
-
55
-
56
-
57
-
58
-
59
-
60
-
61
-
62
-
63
-
64
-
65
-
66
-
67
-
68
-
69
-
70
-
71
-
72
-
73
-
74
-
75
-
76
-
77
-
78
-
79
-
80
-
81
-
82
-
83
-
84
-
85
-
86
-
87
-
88
-
89
-
90
-
91
-
92
-
93
-
94
-
95
-
96
-
97
-
98
-
99
-
100
-
101
-
102
-
103
-
104
-
105
-
106
-
107
-
108
-
109
-
110
-
111
-
112
-
113
-
114
-
115
-
116
-
117
-
118
-
119
-
120
-
121
-
122
-
123
-
124
-
125
-
126
-
127
-
128
-
129
 |
 |

Table of Contents
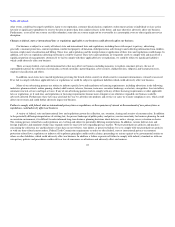
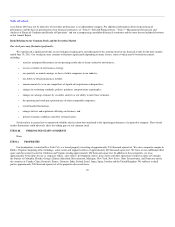
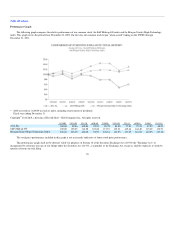
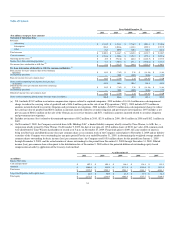
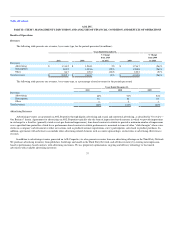
Performance Graph
The following graph compares the relative performance of our common stock, the S&P Midcap 400 index and the Morgan Stanley High-Technology
index. This graph covers the period from November 24, 2009 (the first day our common stock began "when-issued" trading on the NYSE) through
December 31, 2011.
* $100 invested on 11/24/09 in stock or index, including reinvestment of dividends.
Fiscal year ending December 31.
Copyright© 2012 S&P, a division of The McGraw – Hill Companies Inc. All rights reserved.
11/24/09 12/31/09 3/31/10 6/30/10 9/30/10 12/31/10 3/31/11 6/30/11 9/30/11 12/31/11
AOL Inc. 100.00 92.86 100.84 82.93 98.72 94.58 77.90 79.22 47.87 60.23
S&P Midcap 400 100.00 105.03 114.58 103.60 117.19 133.01 145.46 144.40 115.69 130.71
Morgan Stanley High-Technology Index 100.00 103.19 106.08 91.99 103.14 113.93 117.25 116.87 110.55 117.10
The stock price performance included in this graph is not necessarily indicative of future stock price performance.
This performance graph shall not be deemed "filed" for purposes of Section 18 of the Securities Exchange Act of 1934 (the "Exchange Act") or
incorporated by reference into any of our filings under the Securities Act of 1933, as amended, or the Exchange Act, except as shall be expressly set forth by
specific reference in such filing.
29