America Online 2011 Annual Report Download - page 51
Download and view the complete annual report
Please find page 51 of the 2011 America Online annual report below. You can navigate through the pages in the report by either clicking on the pages listed below, or by using the keyword search tool below to find specific information within the annual report.-
 1
1 -
2
-
3
-
4
-
5
-
6
-
7
-
8
-
9
-
10
-
11
-
12
-
13
-
14
-
15
-
16
-
17
-
18
-
19
-
20
-
21
-
22
-
23
-
24
-
25
-
26
-
27
-
28
-
29
-
30
-
31
-
32
-
33
-
34
-
35
-
36
-
37
-
38
-
39
-
40
-
 41
41 -
 42
42 -
 43
43 -
 44
44 -
 45
45 -
 46
46 -
 47
47 -
 48
48 -
 49
49 -
 50
50 -
 51
51 -
 52
52 -
 53
53 -
 54
54 -
 55
55 -
 56
56 -
 57
57 -
 58
58 -
 59
59 -
 60
60 -
 61
61 -
62
-
63
-
64
-
65
-
66
-
67
-
68
-
69
-
70
-
71
-
72
-
73
-
74
-
75
-
76
-
77
-
78
-
79
-
80
-
81
-
82
-
83
-
84
-
85
-
86
-
87
-
88
-
89
-
90
-
91
-
92
-
93
-
94
-
95
-
96
-
97
-
98
-
99
-
100
-
101
-
102
-
103
-
104
-
105
-
106
-
107
-
108
-
109
-
110
-
111
-
112
-
113
-
114
-
115
-
116
-
117
-
118
-
119
-
120
-
121
-
122
-
123
-
124
-
125
-
126
-
127
-
128
-
129
 |
 |
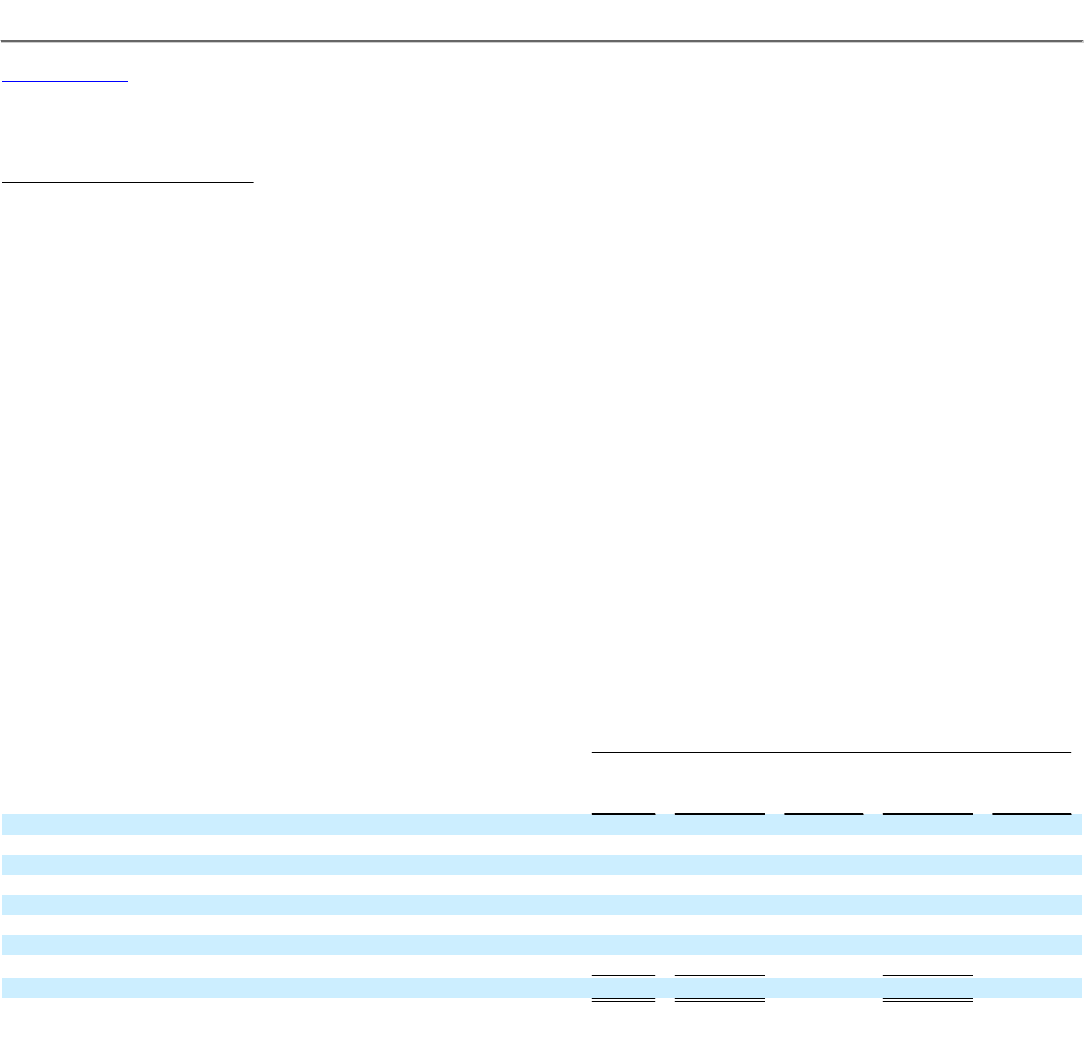
Table of Contents
AOL INC.
PART II—ITEM 7. MANAGEMENT'S DISCUSSION AND ANALYSIS OF FINANCIAL CONDITION AND RESULTS OF OPERATIONS
Discontinued Operations, Net of Tax
The financial results for the years ended December 31, 2010 and 2009 include the impact of reflecting the results of operations, financial condition and
cash flows of buy.at as discontinued operations. We completed the sale of buy.at on February 26, 2010 and accordingly, the year ended December 31, 2010
included the results of operations of buy.at for the period from January 1, 2010 through February 26, 2010, the pre-tax loss on the sale of buy.at and the
income tax benefit associated with the buy.at operations and sale.
Adjusted OIBDA
We use Adjusted OIBDA as a supplemental measure of our performance. We define Adjusted OIBDA as operating income before depreciation and
amortization excluding the impact of restructuring costs, non-cash equity-based compensation, gains and losses on all disposals of assets (including those
recorded in costs of revenues) and non-cash asset impairments and write-offs. We consider Adjusted OIBDA to be a useful metric for management and
investors to evaluate and compare the ongoing operating performance of our business on a consistent basis across reporting periods, as it eliminates the effect
of non-cash items such as depreciation of tangible assets, amortization of intangible assets that were primarily recognized in business combinations, asset
impairments and write-offs, as well as the effect of restructurings and gains and losses on asset sales, which we do not believe are indicative of our core
operating performance. We exclude the impacts of equity-based compensation to allow us to be more closely aligned with the industry and analyst
community. A limitation of this measure, however, is that it does not reflect the periodic costs of certain capitalized tangible and intangible assets used in
generating revenues in our business or the current or future expected cash expenditures for restructuring costs. The Adjusted OIBDA measure also does not
include equity-based compensation, which is and will remain a key element of our overall long-term compensation package. Moreover, the Adjusted OIBDA
measures do not reflect gains and losses on asset sales or impairment charges and write-offs related to goodwill, intangible assets and fixed assets which
impact our operating performance. We evaluate the investments in such tangible and intangible assets through other financial measures, such as capital
expenditure budgets, investment spending levels and return on capital.
Adjusted OIBDA is a non-GAAP financial measure and may be different than similarly-titled non-GAAP financial measures used by other companies.
The presentation of this financial information is not intended to be considered in isolation or as a substitute for the financial information prepared and
presented in accordance with generally accepted accounting principles ("GAAP").
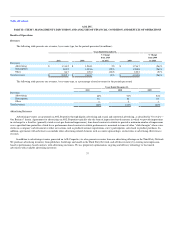
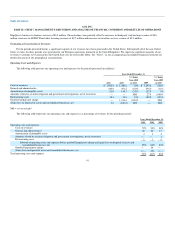
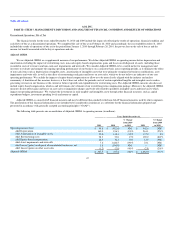
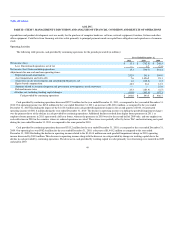
The following table presents our reconciliation of Adjusted OIBDA to operating income (in millions):
Years Ended December 31,
2011 2010
% Change
from 2010
to 2011 2009
% Change
from 2009
to 2010
Operating income (loss) $ 45.8 $ (982.6) NM $ 462.6 NM
Add: Depreciation 160.9 196.3 (18)% 261.1 (25)%
Add: Amortization of intangible assets 92.0 145.3 (37)% 137.9 5%
Add: Restructuring costs 38.3 33.8 13% 189.2 (82)%
Add: Equity-based compensation 42.5 36.1 18% 12.5 NM
Add: Asset impairments and write-offs 7.6 1,426.5 (99)% 23.1 NM
Add: Losses/(gains) on disposal of consolidated businesses, net 1.6 (106.0) NM — NM
Add: Losses/(gains) on other asset sales (1.2) (2.0) (40)% (2.5) (20)%
Adjusted OIBDA $ 387.5 $ 747.4 (48)% $ 1,083.9 (31)%
47