America Online 2011 Annual Report Download - page 42
Download and view the complete annual report
Please find page 42 of the 2011 America Online annual report below. You can navigate through the pages in the report by either clicking on the pages listed below, or by using the keyword search tool below to find specific information within the annual report.-
 1
1 -
2
-
3
-
4
-
5
-
6
-
7
-
8
-
9
-
10
-
11
-
12
-
13
-
14
-
15
-
16
-
17
-
18
-
19
-
20
-
21
-
22
-
23
-
24
-
25
-
26
-
27
-
28
-
29
-
30
-
31
-
 32
32 -
 33
33 -
 34
34 -
 35
35 -
 36
36 -
 37
37 -
 38
38 -
 39
39 -
 40
40 -
 41
41 -
 42
42 -
 43
43 -
 44
44 -
 45
45 -
 46
46 -
 47
47 -
 48
48 -
 49
49 -
 50
50 -
 51
51 -
 52
52 -
53
-
54
-
55
-
56
-
57
-
58
-
59
-
60
-
61
-
62
-
63
-
64
-
65
-
66
-
67
-
68
-
69
-
70
-
71
-
72
-
73
-
74
-
75
-
76
-
77
-
78
-
79
-
80
-
81
-
82
-
83
-
84
-
85
-
86
-
87
-
88
-
89
-
90
-
91
-
92
-
93
-
94
-
95
-
96
-
97
-
98
-
99
-
100
-
101
-
102
-
103
-
104
-
105
-
106
-
107
-
108
-
109
-
110
-
111
-
112
-
113
-
114
-
115
-
116
-
117
-
118
-
119
-
120
-
121
-
122
-
123
-
124
-
125
-
126
-
127
-
128
-
129
 |
 |

Table of Contents
AOL INC.
PART II—ITEM 7. MANAGEMENT'S DISCUSSION AND ANALYSIS OF FINANCIAL CONDITION AND RESULTS OF OPERATIONS
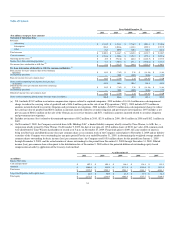
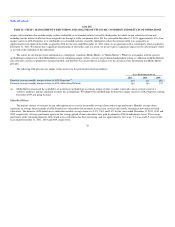
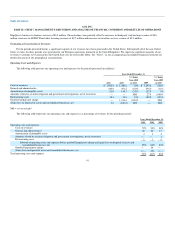
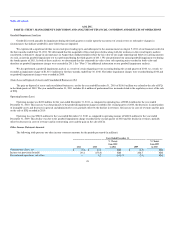
Advertising revenues on AOL Properties and the Third Party Network for the years ended December 31, 2011, 2010 and 2009 are as follows (in
millions):
Years Ended December 31,
2011 2010
% Change
from 2010
to 2011 2009
% Change
from 2009
to 2010
AOL Properties:
Display $ 573.4 $ 512.3 12% $ 597.5 (14)%
Display—domestic 530.1 464.5 14% 507.3 (8)%
Display—international 43.3 47.8 (9)% 90.2 (47)%
Search and Contextual 357.1 428.1 (17)% 609.8 (30)%
Total AOL Properties 930.5 940.4 (1)% 1,207.3 (22)%
Third Party Network 383.7 343.7 12% 529.4 (35)%
Total advertising revenues $ 1,314.2 $ 1,284.1 2% $ 1,736.7 (26)%
2011 vs. 2010
Advertising revenues increased $30.1 million for the year ended December 31, 2011 as compared to the year ended December 31, 2010, reflecting an
$88.6 million increase in our core product offerings (including the impact of recent acquisitions), partially offset by a $58.5 million decline related to
initiatives implemented by AOL in late 2009 and early 2010 in connection with restructuring our business.
Excluding the impact from the AOL-implemented initiatives discussed further below, advertising revenue for the year ended December 31, 2011 as
compared to the year ended December 31, 2010 reflects increases in display revenue and Third Party Network revenue, partially offset by declines in search
and contextual revenue. Display revenue increased $74.5 million primarily due to increased revenue from premium display advertising, a portion of which is
attributable to our acquisitions of TechCrunch, Inc. ("TechCrunch") and The Huffington Post. The increase in display revenue also includes the impact of
improved yield management across our properties, an increase in Patch revenues and an increase in performance-based fees related to marketing of third party
products and services. The Third Party Network revenue increase of $70.1 million relates primarily to an increase in advertisers and publishers on the network
and the acquisitions of goviral and 5Min. Domestic search and contextual revenue declined $40.3 million primarily related to fewer domestic queries, due in
large part to a decline in queries from legacy cobranded portals and a 15% year-over-year decrease in domestic AOL-brand access subscribers. International
search and contextual revenue declines of $15.7 million were due to fewer queries primarily in the United Kingdom. These declines in search and contextual
revenue include an offsetting impact related to growth in search revenue on AOL.com.
Apart from the increase in our core product offerings, advertising revenue reflects declines of $58.5 million related to AOL-implemented initiatives to
wind down or shut down certain products and shut down or reduce operations internationally. The impact of these initiatives included declines in Third Party
Network revenue of $30.1 million associated with European shutdowns and de-emphasis of the typically low margin search engine campaign management
and lead generation affiliate products. In addition, we experienced declines in search and contextual revenue of $15.0 million primarily due to declines of
$12.2 million from ICQ which we sold in the third quarter of 2010. Display revenues declined $13.4 million due to the sale of ICQ, Digital Marketing
Services, Inc. and Bebo, Inc. ("Bebo") in 2010, and due to our reduced operations in Germany and France.
38