America Online 2011 Annual Report Download - page 68
Download and view the complete annual report
Please find page 68 of the 2011 America Online annual report below. You can navigate through the pages in the report by either clicking on the pages listed below, or by using the keyword search tool below to find specific information within the annual report.-
 1
1 -
2
-
3
-
4
-
5
-
6
-
7
-
8
-
9
-
10
-
11
-
12
-
13
-
14
-
15
-
16
-
17
-
18
-
19
-
20
-
21
-
22
-
23
-
24
-
25
-
26
-
27
-
28
-
29
-
30
-
31
-
32
-
33
-
34
-
35
-
36
-
37
-
38
-
39
-
40
-
41
-
42
-
43
-
44
-
45
-
46
-
47
-
48
-
49
-
50
-
51
-
52
-
53
-
54
-
55
-
56
-
57
-
 58
58 -
 59
59 -
 60
60 -
 61
61 -
 62
62 -
 63
63 -
 64
64 -
 65
65 -
 66
66 -
 67
67 -
 68
68 -
 69
69 -
 70
70 -
 71
71 -
 72
72 -
 73
73 -
 74
74 -
 75
75 -
 76
76 -
 77
77 -
 78
78 -
79
-
80
-
81
-
82
-
83
-
84
-
85
-
86
-
87
-
88
-
89
-
90
-
91
-
92
-
93
-
94
-
95
-
96
-
97
-
98
-
99
-
100
-
101
-
102
-
103
-
104
-
105
-
106
-
107
-
108
-
109
-
110
-
111
-
112
-
113
-
114
-
115
-
116
-
117
-
118
-
119
-
120
-
121
-
122
-
123
-
124
-
125
-
126
-
127
-
128
-
129
 |
 |

Table of Contents
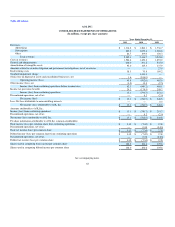
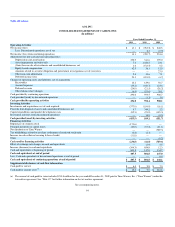
AOL INC.
CONSOLIDATED STATEMENTS OF CASH FLOWS
(In millions)
Years Ended December 31,
2011 2010 2009
Operating Activities
Net income (loss) $ 13.1 $ (782.5) $ 248.5
Less: Discontinued operations, net of tax — 8.2 (2.9)
Net income (loss) from continuing operations 13.1 (790.7) 251.4
Adjustments for non-cash and non-operating items:
Depreciation and amortization 252.9 341.6 399.0
Asset impairments and write-offs 7.6 1,426.5 23.1
(Gain) loss on sale of investments and consolidated businesses, net 1.6 (132.5) 0.2
Equity-based compensation 42.5 36.1 12.5
Amounts related to securities litigation and government investigations, net of recoveries — — 27.9
Other non-cash adjustments 2.4 10.6 7.1
Deferred income taxes 23.3 (183.9) (4.7)
Changes in operating assets and liabilities, net of acquisitions
Receivables 12.2 129.6 56.7
Accrued expenses (29.2) (168.7) 123.6
Deferred revenue (24.0) (21.5) (28.2)
Other balance sheet changes (6.4) (53.6) 38.1
Cash provided by continuing operations 296.0 593.5 906.7
Cash provided (used) by discontinued operations — (1.1) 1.4
Cash provided by operating activities 296.0 592.4 908.1
Investing Activities
Investments and acquisitions, net of cash acquired (377.9) (154.0) (18.1)
Proceeds from disposal of assets and consolidated businesses, net 4.7 344.2 2.2
Capital expenditures and product development costs (82.3) (95.9) (135.3)
Investment activities from discontinued operations — 14.8 (0.5)
Cash provided (used) by investing activities (455.5) 109.1 (151.7)
Financing Activities
Repurchase of common stock (173.6) — —
Principal payments on capital leases (49.0) (37.5) (31.1)
Net distribution to Time Warner — — (709.3)
Tax withholdings related to net share settlements of restricted stock units (0.4) (4.3) —
Increase in cash collateral securing letters of credit (11.8) — —
Other — — (9.2)
Cash used by financing activities (234.8) (41.8) (749.6)
Effect of exchange rate changes on cash and equivalents — (4.9) 5.5
Increase (decrease) in cash and equivalents (394.3) 654.8 12.3
Cash and equivalents at beginning of period 801.8 147.0 134.7
Cash and equivalents at end of period 407.5 801.8 147.0
Less: Cash and equivalents of discontinued operations at end of period — — 0.9
Cash and equivalents of continuing operations at end of period $ 407.5 $ 801.8 $ 146.1
Supplemental disclosures of cash flow information
Cash paid for interest $ 6.4 $ 9.8 $ 7.3
Cash paid for income taxes (a) $ 15.0 $ 9.9 $ 216.8
(a) The amount of cash paid for taxes includes $210.8 million for the year ended December 31, 2009 paid to Time Warner, Inc. ("Time Warner") under the
tax matters agreement. See "Note 12" for further information on the tax matters agreement.
See accompanying notes.
64