America Online 2011 Annual Report Download - page 80
Download and view the complete annual report
Please find page 80 of the 2011 America Online annual report below. You can navigate through the pages in the report by either clicking on the pages listed below, or by using the keyword search tool below to find specific information within the annual report.-
 1
1 -
2
-
3
-
4
-
5
-
6
-
7
-
8
-
9
-
10
-
11
-
12
-
13
-
14
-
15
-
16
-
17
-
18
-
19
-
20
-
21
-
22
-
23
-
24
-
25
-
26
-
27
-
28
-
29
-
30
-
31
-
32
-
33
-
34
-
35
-
36
-
37
-
38
-
39
-
40
-
41
-
42
-
43
-
44
-
45
-
46
-
47
-
48
-
49
-
50
-
51
-
52
-
53
-
54
-
55
-
56
-
57
-
58
-
59
-
60
-
61
-
62
-
63
-
64
-
65
-
66
-
67
-
68
-
69
-
 70
70 -
 71
71 -
 72
72 -
 73
73 -
 74
74 -
 75
75 -
 76
76 -
 77
77 -
 78
78 -
 79
79 -
 80
80 -
 81
81 -
 82
82 -
 83
83 -
 84
84 -
 85
85 -
 86
86 -
 87
87 -
 88
88 -
 89
89 -
 90
90 -
91
-
92
-
93
-
94
-
95
-
96
-
97
-
98
-
99
-
100
-
101
-
102
-
103
-
104
-
105
-
106
-
107
-
108
-
109
-
110
-
111
-
112
-
113
-
114
-
115
-
116
-
117
-
118
-
119
-
120
-
121
-
122
-
123
-
124
-
125
-
126
-
127
-
128
-
129
 |
 |

Table of Contents
AOL INC.
NOTES TO THE CONSOLIDATED FINANCIAL STATEMENTS
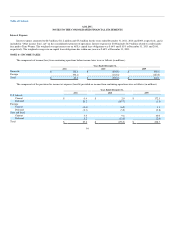
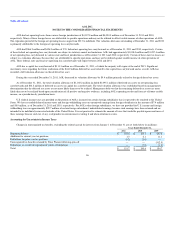
For the year ended December 31, 2011, the Company had 104.2 million weighted-average shares outstanding which were used to calculate basic
income (loss) per common share. The Company had 9.0 million of weighted-average potentially dilutive common shares that were not included in the
computation of diluted income (loss) per common share for the year ended December 31, 2011, because to do so would have been anti-dilutive for the period.
For the year ended December 31, 2010, the Company had 106.6 million weighted-average shares outstanding which were used to calculate basic
income (loss) per common share. The Company had 5.8 million of weighted-average potentially dilutive common shares that were not included in the
computation of diluted income (loss) per common share for the year ended December 31, 2010, because to do so would have been anti-dilutive for the period.
For the year ended December 31, 2009, in determining the weighted average number of common shares outstanding for basic income (loss) per
common share, the Company assumed 105.8 million shares were outstanding for the period from January 1, 2009 through December 9, 2009. Certain stock
options and restricted stock units granted to employees in 2009 have a dilutive effect on income (loss) per share; however, the dilutive effect is not significant
to the total weighted-average shares outstanding for 2009 since dilutive shares were only outstanding from December 10, 2009 through December 31, 2009.
Accordingly, for the year ended December 31, 2009, AOL's weighted average number of common shares outstanding for diluted income (loss) per common
share was 105.8 million.
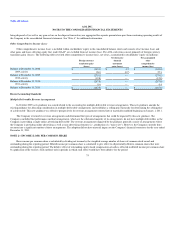
Years Ended December 31,
2011 2010 2009
Net income (loss) attributable to AOL Inc. common stockholders $ 13.1 $ (782.5) $ 248.8
Shares used in computing basic income per common share 104.2 106.6 105.8
Dilutive effect of equity-based awards 1.8 — —
Shares used in computing diluted income per common share 106.0 106.6 105.8
Basic net income (loss) per common share $ 0.13 $ (7.34) $ 2.35
Diluted net income (loss) per common share $ 0.12 $ (7.34) $ 2.35
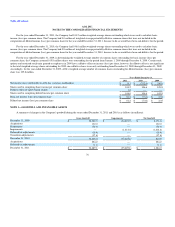
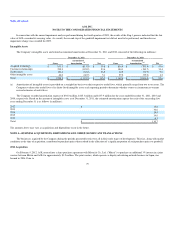
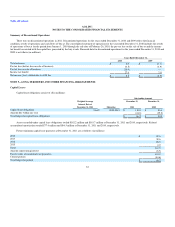
NOTE 3—GOODWILL AND INTANGIBLE ASSETS
A summary of changes in the Company's goodwill during the years ended December 31, 2011 and 2010 is as follows (in millions):
Gross Goodwill Impairments Net Goodwill
December 31, 2009 $ 36,382.3 $ (34,210.7) $ 2,171.6
Acquisitions 132.0 — 132.0
Dispositions (50.3) — (50.3)
Impairments — (1,414.4) (1,414.4)
Deferred tax adjustments (10.4) — (10.4)
Translation adjustments (17.6) — (17.6)
December 31, 2010 36,436.0 (35,625.1) 810.9
Acquisitions 254.2 — 254.2
Deferred tax adjustments (1.1) — (1.1)
December 31, 2011 $ 36,689.1 $ (35,625.1) $ 1,064.0
76