America Online 2011 Annual Report Download - page 45
Download and view the complete annual report
Please find page 45 of the 2011 America Online annual report below. You can navigate through the pages in the report by either clicking on the pages listed below, or by using the keyword search tool below to find specific information within the annual report.-
 1
1 -
2
-
3
-
4
-
5
-
6
-
7
-
8
-
9
-
10
-
11
-
12
-
13
-
14
-
15
-
16
-
17
-
18
-
19
-
20
-
21
-
22
-
23
-
24
-
25
-
26
-
27
-
28
-
29
-
30
-
31
-
32
-
33
-
34
-
 35
35 -
 36
36 -
 37
37 -
 38
38 -
 39
39 -
 40
40 -
 41
41 -
 42
42 -
 43
43 -
 44
44 -
 45
45 -
 46
46 -
 47
47 -
 48
48 -
 49
49 -
 50
50 -
 51
51 -
 52
52 -
 53
53 -
 54
54 -
 55
55 -
56
-
57
-
58
-
59
-
60
-
61
-
62
-
63
-
64
-
65
-
66
-
67
-
68
-
69
-
70
-
71
-
72
-
73
-
74
-
75
-
76
-
77
-
78
-
79
-
80
-
81
-
82
-
83
-
84
-
85
-
86
-
87
-
88
-
89
-
90
-
91
-
92
-
93
-
94
-
95
-
96
-
97
-
98
-
99
-
100
-
101
-
102
-
103
-
104
-
105
-
106
-
107
-
108
-
109
-
110
-
111
-
112
-
113
-
114
-
115
-
116
-
117
-
118
-
119
-
120
-
121
-
122
-
123
-
124
-
125
-
126
-
127
-
128
-
129
 |
 |
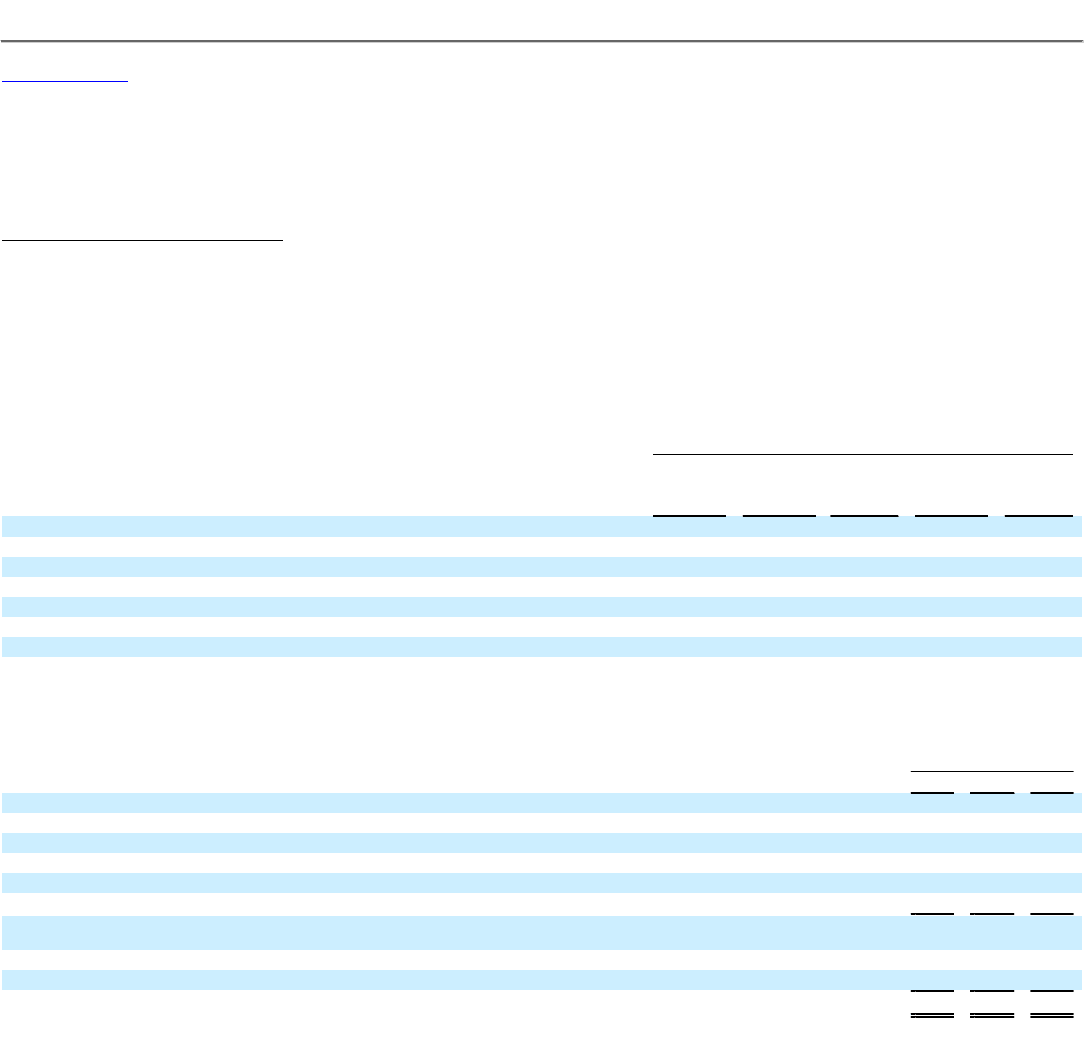
Table of Contents
AOL INC.
PART II—ITEM 7. MANAGEMENT'S DISCUSSION AND ANALYSIS OF FINANCIAL CONDITION AND RESULTS OF OPERATIONS
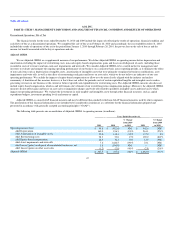
MapQuest's business-to-business services of $6.9 million. These declines were partially offset by increases in third party web hosting revenues of $8.8
million, increases in ADTECH and other licensing revenues of $2.7 million and increases in transition services revenue of $2.9 million.
Geographical Concentration of Revenues
For the periods presented herein, a significant majority of our revenues have been generated in the United States. Substantially all of the non-United
States revenues for these periods were generated by our European operations (primarily in the United Kingdom). We expect the significant majority of our
revenues to continue to be generated in the United States for the foreseeable future. See "Note 1" in our accompanying consolidated financial statements for
further discussion of our geographical concentrations.
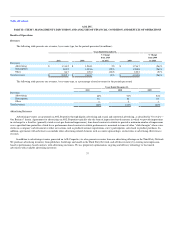
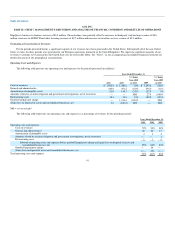
Operating Costs and Expenses
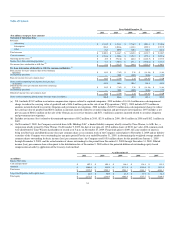
The following table presents our operating costs and expenses for the periods presented (in millions):
Years Ended December 31,
2011 2010
% Change
from 2010
to 2011 2009
% Change
from 2009
to 2010
Costs of revenues $ 1,584.4 $ 1,420.6 12% $ 1,893.2 (25)%
General and administrative 440.0 491.2 (10)% 535.0 (8)%
Amortization of intangible assets 92.0 145.3 (37)% 137.9 5%
Amounts related to securities litigation and government investigations, net of recoveries — — NM 27.9 (100)%
Restructuring costs 38.3 33.8 13% 189.2 (82)%
Goodwill impairment charge — 1,414.4 (100)% — NM
(Gain) loss on disposal of assets and consolidated businesses, net 1.6 (106.0) NM — NM
NM = not meaningful
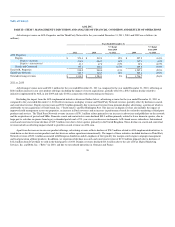
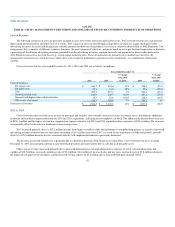
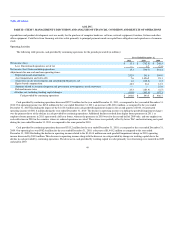
The following table represents our operating costs and expenses as a percentage of revenues for the periods presented:
Years Ended December 31,
2011 2010 2009
Operating costs and expenses:
Costs of revenues 72% 59% 58%
General and administrative 20 20 17
Amortization of intangible assets 4 6 4
Amounts related to securities litigation and government investigations, net of recoveries — — 1
Restructuring costs 2 1 6
Subtotal of operating costs and expenses before goodwill impairment charge and (gain) loss on disposal of assets and
consolidated businesses, net 98% 86% 86%
Goodwill impairment charge — 59 —
(Gain) loss on disposal of assets and consolidated businesses, net — (4) —
Total operating costs and expenses 98% 141% 86%
41