America Online 2011 Annual Report Download - page 41
Download and view the complete annual report
Please find page 41 of the 2011 America Online annual report below. You can navigate through the pages in the report by either clicking on the pages listed below, or by using the keyword search tool below to find specific information within the annual report.-
 1
1 -
2
-
3
-
4
-
5
-
6
-
7
-
8
-
9
-
10
-
11
-
12
-
13
-
14
-
15
-
16
-
17
-
18
-
19
-
20
-
21
-
22
-
23
-
24
-
25
-
26
-
27
-
28
-
29
-
30
-
 31
31 -
 32
32 -
 33
33 -
 34
34 -
 35
35 -
 36
36 -
 37
37 -
 38
38 -
 39
39 -
 40
40 -
 41
41 -
 42
42 -
 43
43 -
 44
44 -
 45
45 -
 46
46 -
 47
47 -
 48
48 -
 49
49 -
 50
50 -
 51
51 -
52
-
53
-
54
-
55
-
56
-
57
-
58
-
59
-
60
-
61
-
62
-
63
-
64
-
65
-
66
-
67
-
68
-
69
-
70
-
71
-
72
-
73
-
74
-
75
-
76
-
77
-
78
-
79
-
80
-
81
-
82
-
83
-
84
-
85
-
86
-
87
-
88
-
89
-
90
-
91
-
92
-
93
-
94
-
95
-
96
-
97
-
98
-
99
-
100
-
101
-
102
-
103
-
104
-
105
-
106
-
107
-
108
-
109
-
110
-
111
-
112
-
113
-
114
-
115
-
116
-
117
-
118
-
119
-
120
-
121
-
122
-
123
-
124
-
125
-
126
-
127
-
128
-
129
 |
 |

Table of Contents
AOL INC.
PART II—ITEM 7. MANAGEMENT'S DISCUSSION AND ANALYSIS OF FINANCIAL CONDITION AND RESULTS OF OPERATIONS
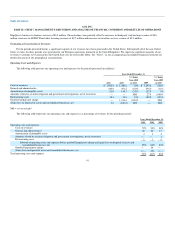
Results of Operations
Revenues
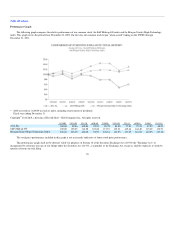
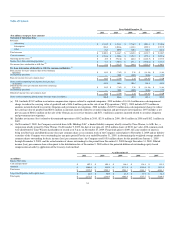
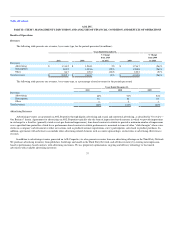
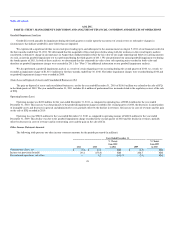
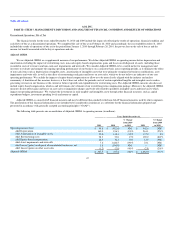
The following table presents our revenues, by revenue type, for the periods presented (in millions):
Years Ended December 31,
2011 2010
% Change
from 2010
to 2011 2009
% Change
from 2009
to 2010
Revenues:
Advertising $ 1,314.2 $ 1,284.1 2% $ 1,736.7 (26)%
Subscription 803.2 1,023.6 (22)% 1,388.8 (26)%
Other 84.7 109.0 (22)% 120.3 (9)%
Total revenues $ 2,202.1 $ 2,416.7 (9)% $ 3,245.8 (26)%
The following table presents our revenues, by revenue type, as a percentage of total revenues for the periods presented:
Years Ended December 31,
2011 2010 2009
Revenues:
Advertising 60% 53% 54%
Subscription 36 42 43
Other 4 5 3
Total revenues 100% 100% 100%
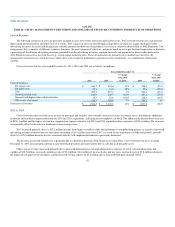
Advertising Revenues
Advertising revenues are generated on AOL Properties through display advertising and search and contextual advertising, as described in "Overview—
Our Business" herein. Agreements for advertising on AOL Properties typically take the form of impression-based contracts in which we provide impressions
in exchange for a fixed fee (generally stated as cost-per-thousand impressions), time-based contracts in which we provide a minimum number of impressions
over a specified time period for a fixed fee or performance-based contracts in which performance is measured in terms of either "click-throughs" when a user
clicks on a company's advertisement or other user actions such as product/customer registrations, survey participation, sales leads or product purchases. In
addition, agreements with advertisers can include other advertising-related elements such as content sponsorships, exclusivities or advertising effectiveness
research.
In addition to advertising revenues generated on AOL Properties, we also generate revenues from our advertising offerings on the Third Party Network.
We purchase advertising inventory from publishers (both large and small) in the Third Party Network, and sell this inventory by entering into impression-
based or performance-based contracts with advertising customers. We use proprietary optimization, targeting and delivery technology to best match
advertisers with available advertising inventory.
37