America Online 2011 Annual Report Download - page 35
Download and view the complete annual report
Please find page 35 of the 2011 America Online annual report below. You can navigate through the pages in the report by either clicking on the pages listed below, or by using the keyword search tool below to find specific information within the annual report.-
 1
1 -
2
-
3
-
4
-
5
-
6
-
7
-
8
-
9
-
10
-
11
-
12
-
13
-
14
-
15
-
16
-
17
-
18
-
19
-
20
-
21
-
22
-
23
-
24
-
 25
25 -
 26
26 -
 27
27 -
 28
28 -
 29
29 -
 30
30 -
 31
31 -
 32
32 -
 33
33 -
 34
34 -
 35
35 -
 36
36 -
 37
37 -
 38
38 -
 39
39 -
 40
40 -
 41
41 -
 42
42 -
 43
43 -
 44
44 -
 45
45 -
46
-
47
-
48
-
49
-
50
-
51
-
52
-
53
-
54
-
55
-
56
-
57
-
58
-
59
-
60
-
61
-
62
-
63
-
64
-
65
-
66
-
67
-
68
-
69
-
70
-
71
-
72
-
73
-
74
-
75
-
76
-
77
-
78
-
79
-
80
-
81
-
82
-
83
-
84
-
85
-
86
-
87
-
88
-
89
-
90
-
91
-
92
-
93
-
94
-
95
-
96
-
97
-
98
-
99
-
100
-
101
-
102
-
103
-
104
-
105
-
106
-
107
-
108
-
109
-
110
-
111
-
112
-
113
-
114
-
115
-
116
-
117
-
118
-
119
-
120
-
121
-
122
-
123
-
124
-
125
-
126
-
127
-
128
-
129
 |
 |

Table of Contents
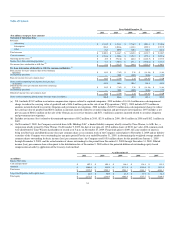
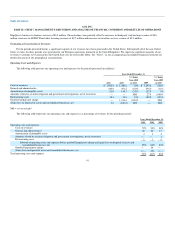
Years Ended December 31,
2011 2010 2009 2008 2007
($ in millions, except per share amounts)
Statement of Operations Data:
Revenues:
Advertising $ 1,314.2 $ 1,284.1 $ 1,736.7 $ 2,083.3 $ 2,230.6
Subscription 803.2 1,023.6 1,388.8 1,929.3 2,787.9
Other 84.7 109.0 120.3 140.1 162.2
Total revenues $ 2,202.1 $ 2,416.7 $ 3,245.8 $ 4,152.7 $ 5,180.7
Costs of revenues $ 1,584.4 $ 1,420.6 $ 1,893.2 $ 2,273.1 $ 2,652.6
Operating income (loss) (a) $ 45.8 $ (982.6) $ 462.6 $ (1,163.5) $ 1,853.8
Income (loss) from continuing operations $ 13.1 $ (790.7) $ 251.4 $ (1,520.6) $ 1,213.3
Net income (loss) attributable to AOL Inc.(b) $ 13.1 $ (782.5) $ 248.8 $ (1,525.8) $ 1,396.1
Per share information attributable to AOL Inc. common stockholders: (c)
Basic income (loss) per common share from continuing
operations $ 0.13 $ (7.42) $ 2.38 $ (14.36) $ 11.48
Discontinued operations — 0.08 (0.03) (0.06) 1.72
Basic net income (loss) per common share $ 0.13 $ (7.34) $ 2.35 $ (14.42) $ 13.20
Shares used in computing basic income (loss) per share
(in millions) 104.2 106.6 105.8 105.8 105.8
Diluted income (loss) per common share from continuing
operations $ 0.12 $ (7.42) $ 2.38 $ (14.36) $ 11.48
Discontinued operations — 0.08 (0.03) (0.06) 1.72
Diluted net income (loss) per common share $ 0.12 $ (7.34) $ 2.35 $ (14.42) $ 13.20
Shares used in computing diluted income (loss) per share (in millions) 106.0 106.6 105.8 105.8 105.8
(a) 2011 includes $35.2 million in retention compensation expense related to acquired companies. 2010 includes a $1,414.4 million non-cash impairment
charge to reduce the carrying value of goodwill and a $106.0 million gain on the sale of our ICQ operations ("ICQ"). 2009 includes $27.9 million in
amounts incurred related to securities litigation and government investigations. 2008 includes a $2,207.0 million non-cash impairment charge to reduce
the carrying value of goodwill and $20.8 million in amounts incurred related to securities litigation and government investigations. 2007 includes a net
pre-tax gain of $668.2 million on the sale of the German access service business and $171.4 million in amounts incurred related to securities litigation
and government investigations.
(b) Includes net income (loss) related to discontinued operations of $8.2 million in 2010, ($2.9) million in 2009, ($6.0) million in 2008 and $182.1 million in
2007.
(c) On November 2, 2009, the Company converted from AOL Holdings LLC, a limited liability company wholly owned by Time Warner, to AOL Inc., a
corporation wholly owned by Time Warner. On December 9, 2009, the date of our spin-off, 105.8 million shares of $0.01 par value AOL common stock
were distributed to Time Warner shareholders of record as of 5 p.m. on November 27, 2009. For periods prior to 2009, the same number of shares is
being used for basic and diluted income (loss) per common share as no common stock of the Company existed prior to November 2, 2009 and no dilutive
securities of the Company were outstanding for any prior period. For the year ended December 31, 2009, in determining the weighted average number of
common shares outstanding for basic income (loss) per common share, the Company used 105.8 million shares for the period from January 1, 2009
through December 9, 2009, and the actual number of shares outstanding for the period from December 10, 2009 through December 31, 2009. Diluted
income (loss) per common share subsequent to the distribution date of December 9, 2009 reflects the potential dilution of outstanding equity-based
compensation awards by application of the treasury stock method.
As of December 31,
2011 2010 2009 2008 2007
(in millions)
Balance Sheet Data:
Cash and equivalents $ 407.5 $ 801.8 $ 146.1 $ 134.8 $ 151.9
Goodwill $ 1,064.0 $ 810.9 $ 2,171.6 $ 2,149.0 $ 3,527.4
Total assets $ 2,825.0 $ 2,962.3 $ 3,963.1 $ 4,861.3 $ 6,863.1
Long-term obligations under capital leases $ 66.2 $ 50.9 $ 41.5 $ 33.7 $ 24.7
Total equity $ 2,172.6 $ 2,286.9 $ 3,062.9 $ 3,737.7 $ 5,269.5
31