America Online 2011 Annual Report Download - page 54
Download and view the complete annual report
Please find page 54 of the 2011 America Online annual report below. You can navigate through the pages in the report by either clicking on the pages listed below, or by using the keyword search tool below to find specific information within the annual report.-
 1
1 -
2
-
3
-
4
-
5
-
6
-
7
-
8
-
9
-
10
-
11
-
12
-
13
-
14
-
15
-
16
-
17
-
18
-
19
-
20
-
21
-
22
-
23
-
24
-
25
-
26
-
27
-
28
-
29
-
30
-
31
-
32
-
33
-
34
-
35
-
36
-
37
-
38
-
39
-
40
-
41
-
42
-
43
-
 44
44 -
 45
45 -
 46
46 -
 47
47 -
 48
48 -
 49
49 -
 50
50 -
 51
51 -
 52
52 -
 53
53 -
 54
54 -
 55
55 -
 56
56 -
 57
57 -
 58
58 -
 59
59 -
 60
60 -
 61
61 -
 62
62 -
 63
63 -
 64
64 -
65
-
66
-
67
-
68
-
69
-
70
-
71
-
72
-
73
-
74
-
75
-
76
-
77
-
78
-
79
-
80
-
81
-
82
-
83
-
84
-
85
-
86
-
87
-
88
-
89
-
90
-
91
-
92
-
93
-
94
-
95
-
96
-
97
-
98
-
99
-
100
-
101
-
102
-
103
-
104
-
105
-
106
-
107
-
108
-
109
-
110
-
111
-
112
-
113
-
114
-
115
-
116
-
117
-
118
-
119
-
120
-
121
-
122
-
123
-
124
-
125
-
126
-
127
-
128
-
129
 |
 |
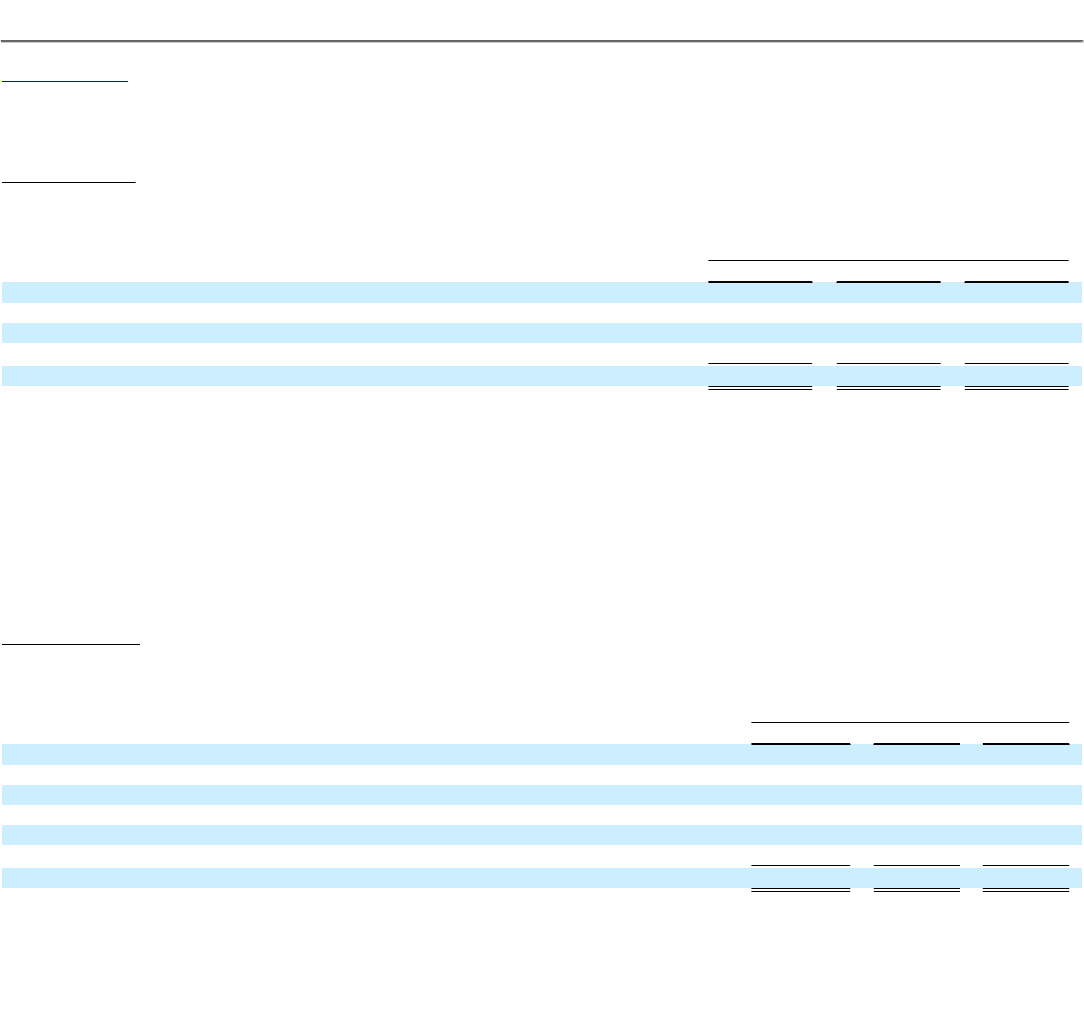
Table of Contents
AOL INC.
PART II—ITEM 7. MANAGEMENT'S DISCUSSION AND ANALYSIS OF FINANCIAL CONDITION AND RESULTS OF OPERATIONS
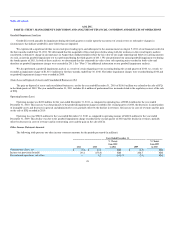
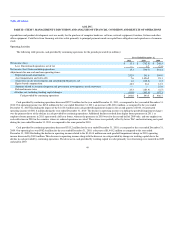
Investing Activities
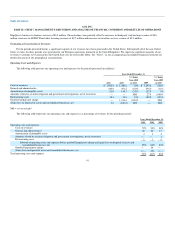
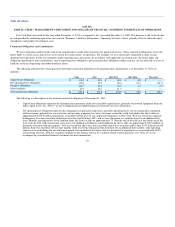
The following table presents cash provided (used) by investing activities for the periods presented (in millions):
Years Ended December 31,
2011 2010 2009
Investments and acquisitions, net of cash acquired $ (377.9) $ (154.0) $ (18.1)
Proceeds from disposal of assets and consolidated businesses, net 4.7 344.2 2.2
Capital expenditures and product development costs (82.3) (95.9) (135.3)
Investment activities from discontinued operations — 14.8 (0.5)
Cash provided (used) by investing activities $ (455.5) $ 109.1 $ (151.7)
Cash used by investing activities was $455.5 million for the year ended December 31, 2011, as compared to cash provided by investing activities of
$109.1 million for the year ended December 31, 2010. The increase in cash used by investing activities was principally due to the acquisitions of The
Huffington Post for $291.9 million and goviral for $69.1 million during the year ended December 31, 2011 as well as the net proceeds from the sale of ICQ of
$173.1 million and Pacific Corporate Park of $127.9 million during the year ended December 31, 2010.
Cash provided by investing activities was $109.1 million for the year ended December 31, 2010, as compared to cash used by investing activities of
$151.7 million for the year ended December 31, 2009. The increase in cash provided by investing activities was due to the net cash proceeds received in the
year ended December 31, 2010 from the sale of ICQ and Pacific Corporate Park as well as a decrease in capital expenditures and product development costs,
partially offset by an increase in cash used for acquisitions. The increase in cash used for acquisitions is due to the acquisition of 5Min, Thing Labs, Inc.,
TechCrunch, Pictela, About.me and StudioNow during 2010.
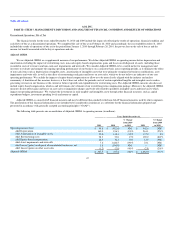
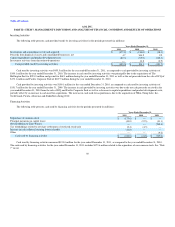
Financing Activities
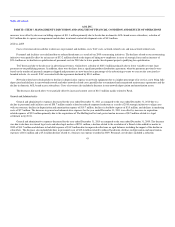
The following table presents cash used by financing activities for the periods presented (in millions):
Years Ended December 31,
2011 2010 2009
Repurchase of common stock $ (173.6) $ — $ —
Principal payments on capital leases (49.0) (37.5) (31.1)
Net distribution to Time Warner — — (709.3)
Tax withholdings related to net share settlements of restricted stock units (0.4) (4.3) —
Increase in cash collateral securing letters of credit (11.8) — —
Other — — (9.2)
Cash used by financing activities $ (234.8) $ (41.8) $ (749.6)
Cash used by financing activities increased $193.0 million for the year ended December 31, 2011, as compared to the year ended December 31, 2010.
The cash used by financing activities for the year ended December 31, 2011 includes $173.6 million related to the repurchase of our common stock. See "Note
7" in our
50