Charter 2002 Annual Report Download - page 123
Download and view the complete annual report
Please find page 123 of the 2002 Charter annual report below. You can navigate through the pages in the report by either clicking on the pages listed below, or by using the keyword search tool below to find specific information within the annual report.-
 1
1 -
2
-
3
-
4
-
5
-
6
-
7
-
8
-
9
-
10
-
11
-
12
-
13
-
14
-
15
-
16
-
17
-
18
-
19
-
20
-
21
-
22
-
23
-
24
-
25
-
26
-
27
-
28
-
29
-
30
-
31
-
32
-
33
-
34
-
35
-
36
-
37
-
38
-
39
-
40
-
41
-
42
-
43
-
44
-
45
-
46
-
47
-
48
-
49
-
50
-
51
-
52
-
53
-
54
-
55
-
56
-
57
-
58
-
59
-
60
-
61
-
62
-
63
-
64
-
65
-
66
-
67
-
68
-
69
-
70
-
71
-
72
-
73
-
74
-
75
-
76
-
77
-
78
-
79
-
80
-
81
-
82
-
83
-
84
-
85
-
86
-
87
-
88
-
89
-
90
-
91
-
92
-
93
-
94
-
95
-
96
-
97
-
98
-
99
-
100
-
101
-
102
-
103
-
104
-
105
-
106
-
107
-
108
-
109
-
110
-
111
-
112
-
 113
113 -
 114
114 -
 115
115 -
 116
116 -
 117
117 -
 118
118 -
 119
119 -
 120
120 -
 121
121 -
 122
122 -
 123
123 -
 124
124 -
 125
125 -
 126
126 -
 127
127 -
 128
128 -
 129
129 -
 130
130
 |
 |

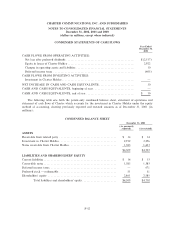
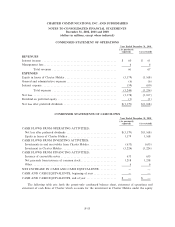
CHARTER COMMUNICATIONS, INC. AND SUBSIDIARIES
NOTES TO CONSOLIDATED FINANCIAL STATEMENTS
December 31, 2002, 2001 and 2000
(dollars in millions, except where indicated)
CONDENSED STATEMENTS OF CASH FLOWS
Year Ended December 31, 2000
(As previously
reported) (As restated)
CASH FLOWS FROM OPERATING ACTIVITIES:
Net lossÏÏÏÏÏÏÏÏÏÏÏÏÏÏÏÏÏÏÏÏÏÏÏÏÏÏÏÏÏÏÏÏÏÏÏÏÏÏÏÏÏÏÏÏÏÏÏÏÏÏÏÏÏÏÏÏÏ $(829) $(858)
Equity in losses of Charter Holdco ÏÏÏÏÏÏÏÏÏÏÏÏÏÏÏÏÏÏÏÏÏÏÏÏÏÏÏÏÏÏÏÏÏÏ 829 858
Changes in operating assets and liabilities ÏÏÏÏÏÏÏÏÏÏÏÏÏÏÏÏÏÏÏÏÏÏÏÏÏÏÏÏ (19) (19)
CASH FLOWS FROM INVESTING ACTIVITIES:
Investments in and receivables from Charter Holdco ÏÏÏÏÏÏÏÏÏÏÏÏÏÏÏÏÏÏÏ (750) (750)
CASH FLOWS FROM FINANCING ACTIVITIES:
Issuance of convertible notes ÏÏÏÏÏÏÏÏÏÏÏÏÏÏÏÏÏÏÏÏÏÏÏÏÏÏÏÏÏÏÏÏÏÏÏÏÏÏÏ 750 750
NET DECREASE IN CASH AND CASH EQUIVALENTSÏÏÏÏÏÏÏÏÏÏÏÏ (19) (19)
CASH AND CASH EQUIVALENTS, beginning of year ÏÏÏÏÏÏÏÏÏÏÏÏÏÏÏÏ 19 19
CASH AND CASH EQUIVALENTS, end of year ÏÏÏÏÏÏÏÏÏÏÏÏÏÏÏÏÏÏÏÏÏ $ Ì $ Ì
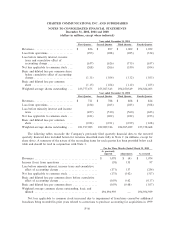
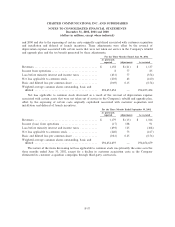
28. Unaudited Quarterly Financial Data (Restated)
The information in this footnote has been revised from the information previously reported to reÖect the
Company's restatement of its Ñnancial statements for the years ended December 31, 2002, 2001 and 2000. See
Note 3 for a description of the restatement.
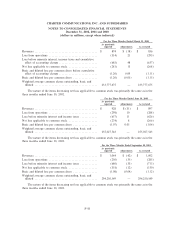
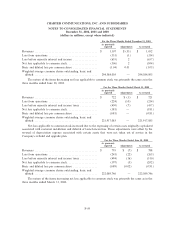
The following table presents quarterly data for the periods presented on the consolidated statement of
operations:
Year ended December 31, 2002
First Quarter Second Quarter Third Quarter Fourth Quarter
RevenuesÏÏÏÏÏÏÏÏÏÏÏÏÏÏÏÏÏÏÏÏÏÏÏÏÏÏÏÏ $ 1,074 $ 1,137 $ 1,166 $ 1,189
Income (loss) from operationsÏÏÏÏÏÏÏÏÏÏ 97 85 91 (4,593)
Loss before minority interest, income
taxes and cumulative eÅect of
accounting change ÏÏÏÏÏÏÏÏÏÏÏÏÏÏÏÏÏÏ (234) (354) (368) (4,991)
Net loss applicable to common stock ÏÏÏÏ (317) (160) (167) (1,873)
Basic and diluted loss per common share
before cumulative eÅect of accounting
change ÏÏÏÏÏÏÏÏÏÏÏÏÏÏÏÏÏÏÏÏÏÏÏÏÏÏÏÏ (0.17) (0.54) (0.56) (6.36)
Basic and diluted loss per common
share ÏÏÏÏÏÏÏÏÏÏÏÏÏÏÏÏÏÏÏÏÏÏÏÏÏÏÏÏÏ (1.07) (0.54) (0.57) (6.36)
Weighted-average shares outstanding ÏÏÏÏ 294,394,939 294,453,454 294,454,659 294,457,934
F-55