Charter 2002 Annual Report Download - page 22
Download and view the complete annual report
Please find page 22 of the 2002 Charter annual report below. You can navigate through the pages in the report by either clicking on the pages listed below, or by using the keyword search tool below to find specific information within the annual report.-
 1
1 -
2
-
3
-
4
-
5
-
6
-
7
-
8
-
9
-
10
-
11
-
 12
12 -
 13
13 -
 14
14 -
 15
15 -
 16
16 -
 17
17 -
 18
18 -
 19
19 -
 20
20 -
 21
21 -
 22
22 -
 23
23 -
 24
24 -
 25
25 -
 26
26 -
 27
27 -
 28
28 -
 29
29 -
 30
30 -
 31
31 -
 32
32 -
33
-
34
-
35
-
36
-
37
-
38
-
39
-
40
-
41
-
42
-
43
-
44
-
45
-
46
-
47
-
48
-
49
-
50
-
51
-
52
-
53
-
54
-
55
-
56
-
57
-
58
-
59
-
60
-
61
-
62
-
63
-
64
-
65
-
66
-
67
-
68
-
69
-
70
-
71
-
72
-
73
-
74
-
75
-
76
-
77
-
78
-
79
-
80
-
81
-
82
-
83
-
84
-
85
-
86
-
87
-
88
-
89
-
90
-
91
-
92
-
93
-
94
-
95
-
96
-
97
-
98
-
99
-
100
-
101
-
102
-
103
-
104
-
105
-
106
-
107
-
108
-
109
-
110
-
111
-
112
-
113
-
114
-
115
-
116
-
117
-
118
-
119
-
120
-
121
-
122
-
123
-
124
-
125
-
126
-
127
-
128
-
129
-
130
 |
 |
network services agreement, were terminated. Charter Communications Holding Company obtained a fairness
opinion from a qualiÑed investment-banking Ñrm regarding the valuation of the assets purchased by CC
Systems pursuant to the asset purchase agreement. Concurrently with the closing of the asset purchase
transaction, High Speed Access Corp. purchased all of its common stock held by Vulcan Ventures
Incorporated for $4.4 million. Following the closing of the asset purchase, neither we nor any of our
subsidiaries nor Vulcan Ventures Incorporated beneÑcially owned any equity securities of High Speed Access.
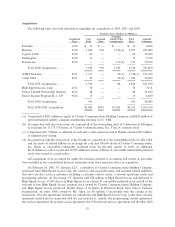
In April 2002, we purchased cable systems in Illinois serving in the aggregate approximately 21,600
customers, for a total cash purchase price of $48 million. In September 2002, we purchased additional Illinois
cable television systems, serving approximately 6,400 customers, for a cash purchase price of $15 million.
Enstar Communications Corporation, a direct subsidiary of Charter Communications Holding Company, is a
general partner of the limited partnerships that sold these systems to us, but does not exercise control over
these partnerships.
We have no current plans to pursue any signiÑcant acquisitions and do not believe that we have access to
the capital markets to make such acquisitions; however, we will continue to evaluate opportunities to
consolidate our operations geographically through the sale of, or exchange of like-kind assets with, other cable
operators as such opportunities arise, and on a very limited basis, consider strategic new acquisitions. Our
primary criteria in considering these opportunities are the rationalization of our operations into geographic
clusters and the potential Ñnancial beneÑts we expect to ultimately realize as a result of the sale, swap, or
acquisition. In addition, we may sell certain assets from time to time. For more information regarding our
history of acquisitions, see Note 5 to our consolidated Ñnancial statements.
Overview of Operations
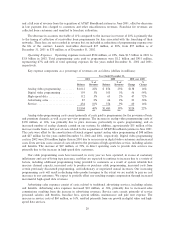
Approximately 87% of our revenues for the year ended December 31, 2002 are attributable to monthly
subscription fees charged to customers for our video and data services, equipment rental and ancillary services
provided by our cable systems. Generally, these customer subscriptions may be discontinued by the customer
at any time. The remaining 13% of revenue is derived primarily from installation and reconnection fees
charged to customers to commence or reinstate service, pay-per-view and video-on-demand programming
where users are charged a fee for individual programs viewed, advertising revenues, commissions related to the
sale of merchandise by home shopping services and franchise fee revenues, which are collected by us but then
paid to local franchising authorities. We have generated increased revenues during the past three years,
primarily through the sale of digital video and high-speed data services to new and existing customers, price
increases on video services and customer growth from acquisitions. Going forward, our strategy is to grow
revenues and improve margins by seeking to reduce analog customer losses and increase revenues per
customer through the sale of data services and digital video services to our existing customer base.
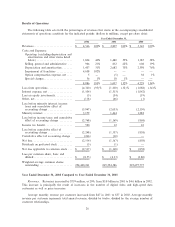
Our expenses primarily consist of operating costs, selling, general and administrative expenses, deprecia-
tion and amortization expense and interest expense. Operating costs primarily include programming costs, the
cost of our workforce, cable service related expenses, and advertising sales costs, franchise fees and expenses
related to customer billings. Our negative operating margins increased from 32% for the year ended
December 31, 2001 to 95% for the year ended December 31, 2002, principally due to the recognition of a
$4.6 billion franchise impairment charge in the fourth quarter of 2002 coupled with depreciation associated
with our capital expenditures related to the construction and upgrading of our systems oÅset by a decrease in
amortization expense as a result of the adoption of SFAS No. 142, which eliminated the amortization of
franchises determined to have an indeÑnite life. Our negative operating margins decreased from 35% for the
year ended December 31, 2000 to 32% for the year ended December 31, 2001 primarily as a result of increased
revenue due to increases in the number of digital video and high-speed data customers. For the year ended
December 31, 2002, our loss from operations was $4.3 billion. Excluding franchise impairment charges, we
generated income from operations of $318 million for the year ended December 31, 2002. We do not expect
charges for impairment in the future of comparable magnitude to the fourth quarter 2002 impairment charge.
We have had a history of net losses. Further, we expect to continue to report net losses for the foreseeable
future. The principal reasons for our prior net losses include our depreciation and amortization expenses,
20