Charter 2002 Annual Report Download - page 31
Download and view the complete annual report
Please find page 31 of the 2002 Charter annual report below. You can navigate through the pages in the report by either clicking on the pages listed below, or by using the keyword search tool below to find specific information within the annual report.-
 1
1 -
2
-
3
-
4
-
5
-
6
-
7
-
8
-
9
-
10
-
11
-
12
-
13
-
14
-
15
-
16
-
17
-
18
-
19
-
20
-
 21
21 -
 22
22 -
 23
23 -
 24
24 -
 25
25 -
 26
26 -
 27
27 -
 28
28 -
 29
29 -
 30
30 -
 31
31 -
 32
32 -
 33
33 -
 34
34 -
 35
35 -
 36
36 -
 37
37 -
 38
38 -
 39
39 -
 40
40 -
 41
41 -
42
-
43
-
44
-
45
-
46
-
47
-
48
-
49
-
50
-
51
-
52
-
53
-
54
-
55
-
56
-
57
-
58
-
59
-
60
-
61
-
62
-
63
-
64
-
65
-
66
-
67
-
68
-
69
-
70
-
71
-
72
-
73
-
74
-
75
-
76
-
77
-
78
-
79
-
80
-
81
-
82
-
83
-
84
-
85
-
86
-
87
-
88
-
89
-
90
-
91
-
92
-
93
-
94
-
95
-
96
-
97
-
98
-
99
-
100
-
101
-
102
-
103
-
104
-
105
-
106
-
107
-
108
-
109
-
110
-
111
-
112
-
113
-
114
-
115
-
116
-
117
-
118
-
119
-
120
-
121
-
122
-
123
-
124
-
125
-
126
-
127
-
128
-
129
-
130
 |
 |

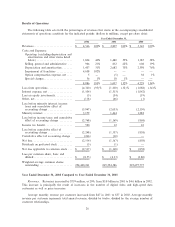
Selling, General and Administrative Expenses. Selling, general and administrative expenses increased
by $134 million, or 16%, from $832 million for the year ended December 31, 2001 to $966 million for the year
ended December 31, 2002. Key components of expense as a percentage of revenues are as follows (dollars in
millions):
Year Ended December 31,
2002 2001 2002 over 2001
% of % of %
Balance Revenues Balance Revenues Change Change
General and administrative ÏÏÏÏÏÏÏÏÏ $813 18% $696 18% $117 17%
Marketing ÏÏÏÏÏÏÏÏÏÏÏÏÏÏÏÏÏÏÏÏÏÏÏ 153 3% 136 4% 17 13%
$966 21% $832 22% $134 16%
General and administrative expenses consist primarily of salaries and beneÑts, rent expense, billing costs,
bad debt expense and property taxes. The increase in general and administrative expenses of $117 million, or
17%, resulted primarily from increases in salaries and beneÑts of $66 million, bad debt and collection expense
of $24 million and insurance of $13 million. These increases were partially oÅset by a decrease in billing
expenses of $12 million as a result of renegotiated contracts with third-party billing providers.
Marketing expenses increased $17 million, or 13%, due to increased costs associated with promotions of
our service oÅerings including advertising, telemarketing and direct sales.
Depreciation and Amortization. Depreciation and amortization expense decreased by $1.2 billion, or
46%, from $2.7 billion in 2001 to $1.4 billion in 2002. This decrease was due primarily to the adoption on
January 1, 2002 of SFAS No. 142, which requires that franchise intangible assets that meet the indeÑnite life
criteria of SFAS No. 142 no longer be amortized against earnings but instead be tested for impairment on an
annual basis. As a result of this change, total amortization of franchise assets decreased from $1.4 billion in
2001 to $9 million in 2002. The decrease was partially oÅset by the increase in depreciation expense related to
additional capital expenditures in 2002.
Impairment Charge. We performed our annual impairment assessment on October 1, 2002 using an
independent third-party appraiser. This valuation led to recognition of a $4.6 billion impairment charge in the
fourth quarter of 2002. We do not expect to incur impairment charges of comparable magnitude in the future.
Option Compensation Expense. Option compensation expense increased by $10 million from $5 million
of net beneÑt in 2001 to $5 million of expense in 2002. The net beneÑt in 2001 was primarily the result of the
reversal of $22 million of expense previously recorded in connection with approximately 7 million options for
which the rights were waived by our former President and Chief Executive OÇcer as part of his September
2001 separation agreement. Option compensation expense was recorded in 2002 because exercise prices on
certain options issued prior to our initial public oÅering in 1999 were less than the estimated fair values of our
common stock at the time of grant. Compensation expense is being accrued over the vesting period of such
options, which ends in April 2004. On January 1, 2003, we adopted SFAS No. 123 using the prospective
method ""Accounting for Stock-Based Compensation'' as the prospective method under which we will
recognize compensation expense of a stock-based award to an employee over the vesting period based on the
fair value of the award on the grant date. For more information see Note 4 to our consolidated Ñnancial
statements.
Special Charges. In the fourth quarter of 2002, we recorded a special charge of $35 million, of which
$31 million is associated with our workforce reduction program. The remaining $4 million is related to legal
and other costs associated with our shareholder lawsuits and governmental investigations. Special charges of
$18 million in 2001 represent charges associated with the transition of approximately 145,000 data customers
from the Excite@Home Internet service to our Charter Pipeline service, as well as employee severance costs.
We expect to continue to record additional special charges in 2003 related to the reorganization of our
operations and costs of litigation.
29