Charter 2002 Annual Report Download - page 28
Download and view the complete annual report
Please find page 28 of the 2002 Charter annual report below. You can navigate through the pages in the report by either clicking on the pages listed below, or by using the keyword search tool below to find specific information within the annual report.-
 1
1 -
2
-
3
-
4
-
5
-
6
-
7
-
8
-
9
-
10
-
11
-
12
-
13
-
14
-
15
-
16
-
17
-
 18
18 -
 19
19 -
 20
20 -
 21
21 -
 22
22 -
 23
23 -
 24
24 -
 25
25 -
 26
26 -
 27
27 -
 28
28 -
 29
29 -
 30
30 -
 31
31 -
 32
32 -
 33
33 -
 34
34 -
 35
35 -
 36
36 -
 37
37 -
 38
38 -
39
-
40
-
41
-
42
-
43
-
44
-
45
-
46
-
47
-
48
-
49
-
50
-
51
-
52
-
53
-
54
-
55
-
56
-
57
-
58
-
59
-
60
-
61
-
62
-
63
-
64
-
65
-
66
-
67
-
68
-
69
-
70
-
71
-
72
-
73
-
74
-
75
-
76
-
77
-
78
-
79
-
80
-
81
-
82
-
83
-
84
-
85
-
86
-
87
-
88
-
89
-
90
-
91
-
92
-
93
-
94
-
95
-
96
-
97
-
98
-
99
-
100
-
101
-
102
-
103
-
104
-
105
-
106
-
107
-
108
-
109
-
110
-
111
-
112
-
113
-
114
-
115
-
116
-
117
-
118
-
119
-
120
-
121
-
122
-
123
-
124
-
125
-
126
-
127
-
128
-
129
-
130
 |
 |

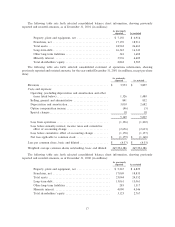
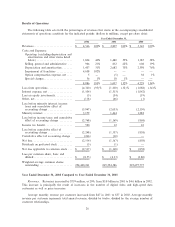
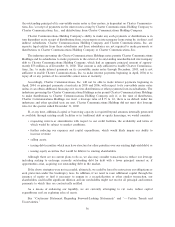
Results of Operations
The following table sets forth the percentages of revenues that items in the accompanying consolidated
statements of operations constitute for the indicated periods (dollars in millions, except per share data):
Year Ended December 31,
2002 2001 2000
RevenuesÏÏÏÏÏÏÏÏÏÏÏÏÏÏÏÏÏÏÏÏÏÏÏÏÏÏÏ $ 4,566 100% $ 3,807 100% $ 3,141 100%
Costs and Expenses:
Operating (excluding depreciation and
amortization and other items listed
below) ÏÏÏÏÏÏÏÏÏÏÏÏÏÏÏÏÏÏÏÏÏÏÏÏÏ 1,804 40% 1,480 39% 1,185 38%
Selling, general and administrative ÏÏÏ 966 21% 832 22% 608 19%
Depreciation and amortization ÏÏÏÏÏÏÏ 1,437 31% 2,682 70% 2,398 76%
Impairment of franchises ÏÏÏÏÏÏÏÏÏÏÏ 4,638 102% Ì Ì Ì Ì
Option compensation expense, net ÏÏÏÏ 5 Ì (5) Ì 38 1%
Special chargesÏÏÏÏÏÏÏÏÏÏÏÏÏÏÏÏÏÏÏÏ 36 1% 18 1% Ì Ì
8,886 195% 5,007 132% 4,229 134%
Loss from operations ÏÏÏÏÏÏÏÏÏÏÏÏÏÏÏÏÏ (4,320) (95)% (1,200) (32)% (1,088) (34)%
Interest expense, net ÏÏÏÏÏÏÏÏÏÏÏÏÏÏÏÏÏ (1,506) (1,313) (1,042)
Loss on equity investments ÏÏÏÏÏÏÏÏÏÏÏÏ (3) (54) (19)
Other, net ÏÏÏÏÏÏÏÏÏÏÏÏÏÏÏÏÏÏÏÏÏÏÏÏÏÏ (118) (66) (1)
Loss before minority interest, income
taxes and cumulative eÅect of
accounting change ÏÏÏÏÏÏÏÏÏÏÏÏÏÏÏÏÏ (5,947) (2,633) (2,150)
Minority interestÏÏÏÏÏÏÏÏÏÏÏÏÏÏÏÏÏÏÏÏÏ 3,179 1,464 1,282
Loss before income taxes and cumulative
eÅect of accounting change ÏÏÏÏÏÏÏÏÏ (2,768) (1,169) (868)
Income tax beneÑt ÏÏÏÏÏÏÏÏÏÏÏÏÏÏÏÏÏÏÏ 520 12 10
Loss before cumulative eÅect of
accounting change ÏÏÏÏÏÏÏÏÏÏÏÏÏÏÏÏÏ (2,248) (1,157) (858)
Cumulative eÅect of accounting change (266) (10) Ì
Net lossÏÏÏÏÏÏÏÏÏÏÏÏÏÏÏÏÏÏÏÏÏÏÏÏÏÏÏÏ (2,514) (1,167) (858)
Dividends on preferred stock ÏÏÏÏÏÏÏÏÏÏ (3) (1) Ì
Net loss applicable to common stock ÏÏÏ $ (2,517) $ (1,168) $ (858)
Loss per common share, basic and
diluted ÏÏÏÏÏÏÏÏÏÏÏÏÏÏÏÏÏÏÏÏÏÏÏÏÏÏÏ $ (8.55) $ (4.33) $ (3.80)
Weighted-average common shares
outstanding ÏÏÏÏÏÏÏÏÏÏÏÏÏÏÏÏÏÏÏÏÏÏÏ 294,440,261 269,594,386 225,697,775
Year Ended December 31, 2002 Compared to Year Ended December 31, 2001
Revenues. Revenues increased by $759 million, or 20%, from $3.8 billion in 2001 to $4.6 billion in 2002.
This increase is principally the result of increases in the number of digital video and high-speed data
customers as well as price increases.
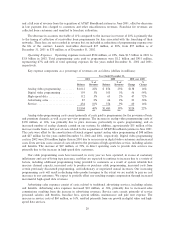
Average monthly revenue per customer increased from $47 in 2001 to $57 in 2002. Average monthly
revenue per customer represents total annual revenue, divided by twelve, divided by the average number of
customer relationships.
26