Charter 2002 Annual Report Download - page 33
Download and view the complete annual report
Please find page 33 of the 2002 Charter annual report below. You can navigate through the pages in the report by either clicking on the pages listed below, or by using the keyword search tool below to find specific information within the annual report.-
 1
1 -
2
-
3
-
4
-
5
-
6
-
7
-
8
-
9
-
10
-
11
-
12
-
13
-
14
-
15
-
16
-
17
-
18
-
19
-
20
-
21
-
22
-
 23
23 -
 24
24 -
 25
25 -
 26
26 -
 27
27 -
 28
28 -
 29
29 -
 30
30 -
 31
31 -
 32
32 -
 33
33 -
 34
34 -
 35
35 -
 36
36 -
 37
37 -
 38
38 -
 39
39 -
 40
40 -
 41
41 -
 42
42 -
 43
43 -
44
-
45
-
46
-
47
-
48
-
49
-
50
-
51
-
52
-
53
-
54
-
55
-
56
-
57
-
58
-
59
-
60
-
61
-
62
-
63
-
64
-
65
-
66
-
67
-
68
-
69
-
70
-
71
-
72
-
73
-
74
-
75
-
76
-
77
-
78
-
79
-
80
-
81
-
82
-
83
-
84
-
85
-
86
-
87
-
88
-
89
-
90
-
91
-
92
-
93
-
94
-
95
-
96
-
97
-
98
-
99
-
100
-
101
-
102
-
103
-
104
-
105
-
106
-
107
-
108
-
109
-
110
-
111
-
112
-
113
-
114
-
115
-
116
-
117
-
118
-
119
-
120
-
121
-
122
-
123
-
124
-
125
-
126
-
127
-
128
-
129
-
130
 |
 |

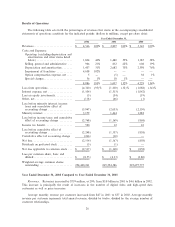
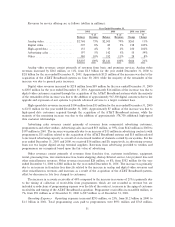
Revenues by service oÅering are as follows (dollars in millions):
Year Ended December 31,
2001 2000 2001 over 2000
% of % of %
Balance Revenues Balance Revenues Change Change
Analog video ÏÏÏÏÏÏÏÏÏÏÏÏÏÏÏÏÏÏÏÏÏ $2,768 73% $2,503 79% $265 11%
Digital video ÏÏÏÏÏÏÏÏÏÏÏÏÏÏÏÏÏÏÏÏÏ 307 8% 89 3% 218 245%
High-speed data ÏÏÏÏÏÏÏÏÏÏÏÏÏÏÏÏÏÏ 155 4% 55 2% 100 182%
Advertising sales ÏÏÏÏÏÏÏÏÏÏÏÏÏÏÏÏÏÏ 197 5% 142 5% 55 39%
Other ÏÏÏÏÏÏÏÏÏÏÏÏÏÏÏÏÏÏÏÏÏÏÏÏÏÏÏ 380 10% 352 11% 28 8%
$3,807 100% $3,141 100% $666 21%
Analog video revenues consist primarily of revenues from basic and premium services. Analog video
revenues increased by $265 million, or 11%, from $2.5 billion for the year ended December 31, 2000 to
$2.8 billion for the year ended December 31, 2001. Approximately $121 million of the increase was due to the
acquisition of the AT&T Broadband systems on June 30, 2001 while the majority of the remainder of the
increase was due to general price increases.
Digital video revenues increased by $218 million from $89 million for the year ended December 31, 2000
to $307 million for the year ended December 31, 2001. Approximately $16 million of the increase was due to
digital video customers acquired through the acquisition of the AT&T Broadband systems while the majority
of the remainder of the increase was due to the addition of approximately 967,300 digital customers due to the
upgrade and expansion of our systems to provide advanced services to a larger customer base.
High-speed data revenues increased $100 million from $55 million for the year ended December 31, 2000
to $155 million for the year ended December 31, 2001. Approximately $7 million of the increase was due to
high-speed data customers acquired through the acquisition of the AT&T Broadband systems, while the
majority of the remaining increase was due to the addition of approximately 378,700 additional high-speed
data customer relationships.
Advertising sales revenues consist primarily of revenues from commercial advertising customers,
programmers and other vendors. Advertising sales increased $55 million, or 39%, from $142 million in 2000 to
$197 million in 2001. The increase was primarily due to an increase of $13 million in advertising contracts with
programmers, $11 million related to the acquisition of the AT&T Broadband systems and $15 million related
to increased advertising capacity as a result of an increased number of channels carried by our systems. For the
year ended December 31, 2001 and 2000, we received $14 million and $0, respectively, in advertising revenue
from our two largest digital set-top terminal suppliers. Revenues from advertising provided to vendors and
programmers are recognized based upon the fair value of advertising.
Other revenues consist primarily of revenues from franchise fees, customer installations, equipment
rental, processing fees, wire maintenance fees, home shopping, dial-up Internet service, late payment fees and
other miscellaneous revenues. Other revenues increased $28 million, or 8%, from $352 million for the year
ended December 31, 2000 to $380 million for the year ended December 31, 2001. The increase was primarily
due to an increase in franchise fees directly related to the increase in analog and digital video revenues and
other miscellaneous revenues and increases as a result of the acquisition of the AT&T Broadband systems,
oÅset by decreases in late fees charged to customers.
The increase in accounts receivable of 40% compared to the increase in revenue of 21% is primarily due
to the timing of collection of receivables from programmers which are not recorded as revenue but are
included as reductions of programming expense over the life of the contract, increases in the aging of customer
receivables and timing of the AT&T Broadband acquisition. Programmer receivables increased $6 million, or
7%, from $91 million as of December 31, 2000 to $97 million as of December 31, 2001.
Operating Expenses. Operating expenses increased $295 million, or 25%, from $1.2 billion in 2000 to
$1.5 billion in 2001. Total programming costs paid to programmers were $951 million and $763 million,
31