Charter 2002 Annual Report Download - page 20
Download and view the complete annual report
Please find page 20 of the 2002 Charter annual report below. You can navigate through the pages in the report by either clicking on the pages listed below, or by using the keyword search tool below to find specific information within the annual report.-
 1
1 -
2
-
3
-
4
-
5
-
6
-
7
-
8
-
9
-
 10
10 -
 11
11 -
 12
12 -
 13
13 -
 14
14 -
 15
15 -
 16
16 -
 17
17 -
 18
18 -
 19
19 -
 20
20 -
 21
21 -
 22
22 -
 23
23 -
 24
24 -
 25
25 -
 26
26 -
 27
27 -
 28
28 -
 29
29 -
 30
30 -
31
-
32
-
33
-
34
-
35
-
36
-
37
-
38
-
39
-
40
-
41
-
42
-
43
-
44
-
45
-
46
-
47
-
48
-
49
-
50
-
51
-
52
-
53
-
54
-
55
-
56
-
57
-
58
-
59
-
60
-
61
-
62
-
63
-
64
-
65
-
66
-
67
-
68
-
69
-
70
-
71
-
72
-
73
-
74
-
75
-
76
-
77
-
78
-
79
-
80
-
81
-
82
-
83
-
84
-
85
-
86
-
87
-
88
-
89
-
90
-
91
-
92
-
93
-
94
-
95
-
96
-
97
-
98
-
99
-
100
-
101
-
102
-
103
-
104
-
105
-
106
-
107
-
108
-
109
-
110
-
111
-
112
-
113
-
114
-
115
-
116
-
117
-
118
-
119
-
120
-
121
-
122
-
123
-
124
-
125
-
126
-
127
-
128
-
129
-
130
 |
 |

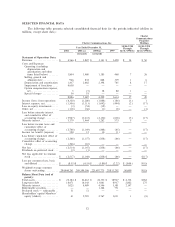
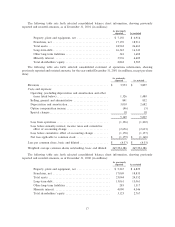
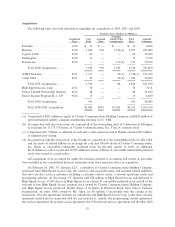
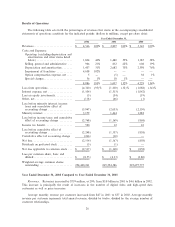
The following table sets forth selected consolidated statement of operations information, showing
previously reported and restated amounts, for the year ended December 31, 2000 (in millions, except per share
data):
As previously
reported As restated
RevenuesÏÏÏÏÏÏÏÏÏÏÏÏÏÏÏÏÏÏÏÏÏÏÏÏÏÏÏÏÏÏÏÏÏÏÏÏÏÏÏÏÏÏÏÏÏÏÏÏ $ 3,249 $ 3,141
Costs and expenses:
Operating (excluding depreciation and amortization and other
items listed below)ÏÏÏÏÏÏÏÏÏÏÏÏÏÏÏÏÏÏÏÏÏÏÏÏÏÏÏÏÏÏÏÏÏÏÏÏ 1,036 1,185
Selling, general and administrative ÏÏÏÏÏÏÏÏÏÏÏÏÏÏÏÏÏÏÏÏÏÏÏÏ 711 646
Depreciation and amortization ÏÏÏÏÏÏÏÏÏÏÏÏÏÏÏÏÏÏÏÏÏÏÏÏÏÏÏÏ 2,473 2,398
4,220 4,229
Loss from operations ÏÏÏÏÏÏÏÏÏÏÏÏÏÏÏÏÏÏÏÏÏÏÏÏÏÏÏÏÏÏÏÏÏÏ (971) (1,088)
Loss before minority interest and income taxes ÏÏÏÏÏÏÏÏÏÏÏÏ (2,055) (2,150)
Net lossÏÏÏÏÏÏÏÏÏÏÏÏÏÏÏÏÏÏÏÏÏÏÏÏÏÏÏÏÏÏÏÏÏÏÏÏÏÏÏÏÏÏÏÏÏÏÏ $ (829) $ (858)
Loss per common share, basic and diluted ÏÏÏÏÏÏÏÏÏÏÏÏÏÏÏÏÏÏÏÏ $ (3.67) $ (3.80)
Weighted average common shares outstanding, basic and diluted 225,697,775 225,697,775
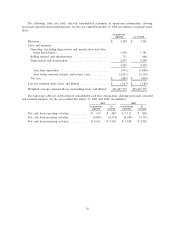
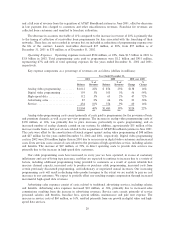
The following table sets forth selected consolidated cash Öow information, showing previously reported
and restated amounts, for the years ended December 31, 2001 and 2000 (in millions):
2001 2000
As previously As As previously As
reported restated reported restated
Net cash from operating activities ÏÏÏÏÏÏÏÏÏÏÏÏ $ 519 $ 489 $ 1,131 $ 828
Net cash from investing activities ÏÏÏÏÏÏÏÏÏÏÏÏ (4,809) (4,774) (4,054) (3,751)
Net cash from Ñnancing activities ÏÏÏÏÏÏÏÏÏÏÏÏ $ 4,162 $ 4,156 $ 2,920 $ 2,920
18