Charter 2002 Annual Report Download - page 34
Download and view the complete annual report
Please find page 34 of the 2002 Charter annual report below. You can navigate through the pages in the report by either clicking on the pages listed below, or by using the keyword search tool below to find specific information within the annual report.-
 1
1 -
2
-
3
-
4
-
5
-
6
-
7
-
8
-
9
-
10
-
11
-
12
-
13
-
14
-
15
-
16
-
17
-
18
-
19
-
20
-
21
-
22
-
23
-
 24
24 -
 25
25 -
 26
26 -
 27
27 -
 28
28 -
 29
29 -
 30
30 -
 31
31 -
 32
32 -
 33
33 -
 34
34 -
 35
35 -
 36
36 -
 37
37 -
 38
38 -
 39
39 -
 40
40 -
 41
41 -
 42
42 -
 43
43 -
 44
44 -
45
-
46
-
47
-
48
-
49
-
50
-
51
-
52
-
53
-
54
-
55
-
56
-
57
-
58
-
59
-
60
-
61
-
62
-
63
-
64
-
65
-
66
-
67
-
68
-
69
-
70
-
71
-
72
-
73
-
74
-
75
-
76
-
77
-
78
-
79
-
80
-
81
-
82
-
83
-
84
-
85
-
86
-
87
-
88
-
89
-
90
-
91
-
92
-
93
-
94
-
95
-
96
-
97
-
98
-
99
-
100
-
101
-
102
-
103
-
104
-
105
-
106
-
107
-
108
-
109
-
110
-
111
-
112
-
113
-
114
-
115
-
116
-
117
-
118
-
119
-
120
-
121
-
122
-
123
-
124
-
125
-
126
-
127
-
128
-
129
-
130
 |
 |

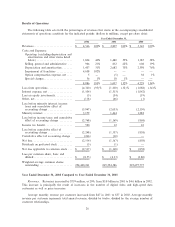
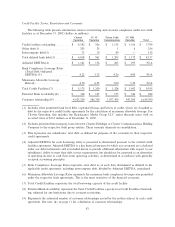
representing 64% and 64% of total operating expenses for the years ended December 31, 2001 and 2000,
respectively.
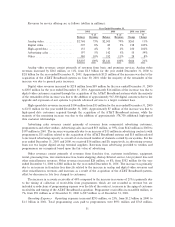
Key expense components as a percentage of revenues are as follows (dollars in millions):
Year Ended December 31,
2001 2000 2001 over 2000
% of % of %
Balance Revenues Balance Revenues Change Change
Analog video programming ÏÏÏÏÏÏÏÏÏ $ 874 23% $ 741 24% $133 18%
Digital video programming ÏÏÏÏÏÏÏÏÏ 103 2% 34 1% 69 203%
High-speed data ÏÏÏÏÏÏÏÏÏÏÏÏÏÏÏÏÏÏ 65 2% 25 1% 40 160%
Advertising sales ÏÏÏÏÏÏÏÏÏÏÏÏÏÏÏÏÏÏ 64 2% 57 2% 7 12%
Service ÏÏÏÏÏÏÏÏÏÏÏÏÏÏÏÏÏÏÏÏÏÏÏÏÏÏ 374 10% 328 10% 46 14%
$1,480 39% $1,185 38% $295 25%
The increase in analog video programming costs of $133 million, or 18%, was primarily due to price
increases, particularly in sports programming, and increased number of channels carried on our systems. In
addition, approximately $37 million of the increase relates to the acquisition of the AT&T Broadband systems.
The increase of $69 million in costs to provide digital video services was primarily due to an increase in digital
customers. The increase of $40 million in direct operating costs to provide data services was primarily due to
the increase in high-speed data customers.
Advertising sales expense consist of costs related to traditional advertising services. Advertising sales
expenses increased $7 million, or 12%, primarily due to increased sales commissions as a result of increases in
advertising revenues. Service costs consist primarily of service personnel salaries and beneÑts, franchise fees,
system utilities, maintenance and pole rent expense. The increase in service costs of $46 million, or 14%,
resulted primarily from our acquisition of the AT&T Broadband systems in June 2001 coupled with the
addition of digital video and high-speed data customers.
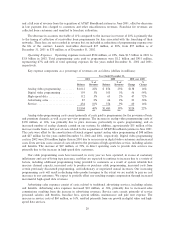
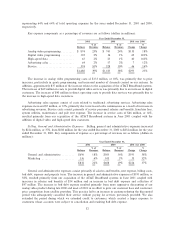
Selling, General and Administrative Expenses. Selling, general and administrative expenses increased
by $224 million, or 37%, from $608 million for the year ended December 31, 2000 to $832 million for the year
ended December 31, 2001. Key components of expense as a percentage of revenues are as follows (dollars in
millions):
Year Ended December 31,
2001 2000 2001 over 2000
% of % of %
Balance Revenues Balance Revenues Change Change
General and administrative ÏÏÏÏÏÏÏÏÏ $696 18% $505 16% $191 38%
Marketing ÏÏÏÏÏÏÏÏÏÏÏÏÏÏÏÏÏÏÏÏÏÏÏ 136 4% 103 3% 33 32%
$832 22% $608 19% $224 37%
General and administrative expenses consist primarily of salaries and beneÑts, rent expense, billing costs,
bad debt, expense and property taxes. The increase in general and administrative expenses of $191 million, or
38%, resulted primarily from our acquisition of the AT&T Broadband systems in June 2001 coupled with
increases in salaries and beneÑts of $54 million and an increase in bad debt expense and collection of
$47 million. The increase in bad debt expense resulted primarily from more aggressive discounting of our
analog video product during late 2000 and most of 2001 in an eÅort to grow our customer base and counteract
price competition from satellite providers. This practice led to an increase in customers during the discounted
period who subsequently cancelled their service without paying for services previously provided. We also
extended the period during which we extended credit to customers, which created a larger exposure to
customers whose accounts were subject to cancellation and resulting bad debt expense.
32