Charter 2002 Annual Report Download - page 30
Download and view the complete annual report
Please find page 30 of the 2002 Charter annual report below. You can navigate through the pages in the report by either clicking on the pages listed below, or by using the keyword search tool below to find specific information within the annual report.-
 1
1 -
2
-
3
-
4
-
5
-
6
-
7
-
8
-
9
-
10
-
11
-
12
-
13
-
14
-
15
-
16
-
17
-
18
-
19
-
 20
20 -
 21
21 -
 22
22 -
 23
23 -
 24
24 -
 25
25 -
 26
26 -
 27
27 -
 28
28 -
 29
29 -
 30
30 -
 31
31 -
 32
32 -
 33
33 -
 34
34 -
 35
35 -
 36
36 -
 37
37 -
 38
38 -
 39
39 -
 40
40 -
41
-
42
-
43
-
44
-
45
-
46
-
47
-
48
-
49
-
50
-
51
-
52
-
53
-
54
-
55
-
56
-
57
-
58
-
59
-
60
-
61
-
62
-
63
-
64
-
65
-
66
-
67
-
68
-
69
-
70
-
71
-
72
-
73
-
74
-
75
-
76
-
77
-
78
-
79
-
80
-
81
-
82
-
83
-
84
-
85
-
86
-
87
-
88
-
89
-
90
-
91
-
92
-
93
-
94
-
95
-
96
-
97
-
98
-
99
-
100
-
101
-
102
-
103
-
104
-
105
-
106
-
107
-
108
-
109
-
110
-
111
-
112
-
113
-
114
-
115
-
116
-
117
-
118
-
119
-
120
-
121
-
122
-
123
-
124
-
125
-
126
-
127
-
128
-
129
-
130
 |
 |

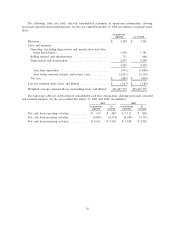
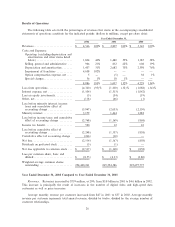
and a full year of revenue from the acquisition of AT&T Broadband systems in June 2001, oÅset by decreases
in late payment fees charged to customers and other miscellaneous revenues. Franchise fee revenues are
collected from customers and remitted to franchise authorities.
The decrease in accounts receivable of 11% compared to the increase in revenue of 20% is primarily due
to the timing of collection of receivables from programmers for fees associated with the launching of their
networks. These fees are not recorded in revenue but are included as reductions of programming expense over
the life of the contract. Launch receivables decreased $27 million, or 28%, from $97 million as of
December 31, 2001 to $70 million as of December 31, 2002.
Operating Expenses. Operating expenses increased $324 million, or 22%, from $1.5 billion in 2001 to
$1.8 billion in 2002. Total programming costs paid to programmers were $1.2 billion and $951 million,
representing 67% and 64% of total operating expenses for the years ended December 31, 2002 and 2001,
respectively.
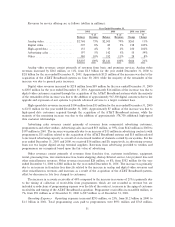
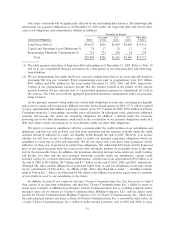
Key expense components as a percentage of revenues are as follows (dollars in millions):
Year Ended December 31,
2001 2000 2001 over 2000
% of % of %
Balance Revenues Balance Revenues Change Change
Analog video programming ÏÏÏÏÏÏÏÏÏ $1,012 22% $ 874 23% $138 16%
Digital video programming ÏÏÏÏÏÏÏÏÏ 159 3% 103 3% 56 54%
High-speed data ÏÏÏÏÏÏÏÏÏÏÏÏÏÏÏÏÏÏ 112 3% 65 2% 47 72%
Advertising sales ÏÏÏÏÏÏÏÏÏÏÏÏÏÏÏÏÏÏ 87 2% 64 2% 23 36%
Service ÏÏÏÏÏÏÏÏÏÏÏÏÏÏÏÏÏÏÏÏÏÏÏÏÏÏ 434 10% 374 9% 60 16%
$1,804 40% $1,480 39% $324 22%
Analog video programming costs consist primarily of costs paid to programmers for the provision of basic
and premium channels as well as pay-per-view programs. The increase in analog video programming costs of
$138 million, or 16%, was primarily due to price increases, particularly in sports programming, and an
increased number of analog channels carried on our systems. In addition, approximately $51 million of the
increase results from a full year of costs related to the acquisition of AT&T Broadband systems in June 2001.
The costs were oÅset by the amortization of launch support against analog video programming of $48 million
and $27 million for the years ended December 31, 2002 and 2001, respectively. Digital video programming
costs in 2002 were $56 million higher than in 2001 due to an increase in digital video customers and increased
costs. Data services costs consist of costs related to the provision of high-speed data service, including salaries
and beneÑts. The increase of $47 million, or 72%, in direct operating costs to provide data services was
primarily due to the increase in high-speed data customers.
Our cable programming costs have increased, in every year we have operated, in excess of customary
inÖationary and cost-of-living type increases, and they are expected to continue to increase due to a variety of
factors, including additional programming being provided to customers as a result of system rebuilds that
increase channel capacity, increased costs to produce or purchase cable programming, increased costs from
certain previously discounted programming, and inÖationary or negotiated annual increases. Our increasing
programming costs will result in declining video product margins to the extent we are unable to pass on cost
increases to our customers. We expect to partially oÅset any resulting margin compression through increased
incremental high-speed data revenues.
Advertising sales expenses consist of costs related to traditional advertising services, including salaries
and beneÑts. Advertising sales expenses increased $23 million, or 36%, primarily due to increased sales
commissions resulting from the increase in advertising revenues. Service costs consist primarily of service
personnel salaries and beneÑts, franchise fees, system utilities, maintenance and pole rent expense. The
increase in service costs of $60 million, or 16%, resulted primarily from our growth in digital video and high-
speed data services.
28