Charter 2002 Annual Report Download - page 14
Download and view the complete annual report
Please find page 14 of the 2002 Charter annual report below. You can navigate through the pages in the report by either clicking on the pages listed below, or by using the keyword search tool below to find specific information within the annual report.-
 1
1 -
2
-
3
-
 4
4 -
 5
5 -
 6
6 -
 7
7 -
 8
8 -
 9
9 -
 10
10 -
 11
11 -
 12
12 -
 13
13 -
 14
14 -
 15
15 -
 16
16 -
 17
17 -
 18
18 -
 19
19 -
 20
20 -
 21
21 -
 22
22 -
 23
23 -
 24
24 -
25
-
26
-
27
-
28
-
29
-
30
-
31
-
32
-
33
-
34
-
35
-
36
-
37
-
38
-
39
-
40
-
41
-
42
-
43
-
44
-
45
-
46
-
47
-
48
-
49
-
50
-
51
-
52
-
53
-
54
-
55
-
56
-
57
-
58
-
59
-
60
-
61
-
62
-
63
-
64
-
65
-
66
-
67
-
68
-
69
-
70
-
71
-
72
-
73
-
74
-
75
-
76
-
77
-
78
-
79
-
80
-
81
-
82
-
83
-
84
-
85
-
86
-
87
-
88
-
89
-
90
-
91
-
92
-
93
-
94
-
95
-
96
-
97
-
98
-
99
-
100
-
101
-
102
-
103
-
104
-
105
-
106
-
107
-
108
-
109
-
110
-
111
-
112
-
113
-
114
-
115
-
116
-
117
-
118
-
119
-
120
-
121
-
122
-
123
-
124
-
125
-
126
-
127
-
128
-
129
-
130
 |
 |

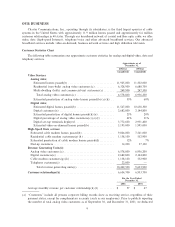
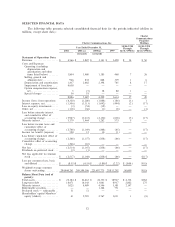
SELECTED FINANCIAL DATA
The following table presents selected consolidated Ñnancial data for the periods indicated (dollars in
millions, except share data):
Charter
Communications
Properties
Charter Communications, Inc. Holdings
12/24/1988 01/01/1998
Year Ended December 31, Through Through
2002 2001(a) 2000(a) 1999 12/31/1998(b) 12/23/1998(b)
(restated) (restated)
Statement of Operations Data:
Revenues ÏÏÏÏÏÏÏÏÏÏÏÏÏÏÏÏÏÏÏ $ 4,566 $ 3,807 $ 3,141 $ 1,428 $ 14 $ 50
Costs and Expenses:
Operating (excluding
depreciation and
amortization and other
items listed below) ÏÏÏÏÏÏÏ 1,804 1,480 1,185 460 7 26
Selling, general and
administrativeÏÏÏÏÏÏÏÏÏÏÏÏ 966 832 608 329 1 6
Depreciation and amortization 1,437 2,682 2,398 745 8 17
Impairment of franchises ÏÏÏÏ 4,638 Ì Ì Ì Ì Ì
Option compensation expense,
net ÏÏÏÏÏÏÏÏÏÏÏÏÏÏÏÏÏÏÏÏÏ 5 (5) 38 80 1 Ì
Special charges ÏÏÏÏÏÏÏÏÏÏÏÏ 36 18 Ì Ì Ì Ì
8,886 5,007 4,229 1,614 17 49
Income (loss) from operations (4,320) (1,200) (1,088) (186) (3) 1
Interest expense, net ÏÏÏÏÏÏÏÏÏÏ (1,506) (1,313) (1,042) (444) (2) (17)
Loss on equity investmentsÏÏÏÏÏ (3) (54) (19) Ì Ì Ì
Other, net ÏÏÏÏÏÏÏÏÏÏÏÏÏÏÏÏÏÏÏ (118) (66) (1) (8) Ì (1)
Loss before minority interest
and cumulative eÅect of
accounting change ÏÏÏÏÏÏÏÏÏÏ (5,947) (2,633) (2,150) (638) (5) (17)
Minority interest ÏÏÏÏÏÏÏÏÏÏÏÏÏ 3,179 1,464 1,282 573 5 Ì
Loss before income taxes and
cumulative eÅect of
accounting change ÏÏÏÏÏÏÏÏÏÏ (2,768) (1,169) (868) (65) Ì (17)
Income tax beneÑt (expense) ÏÏ 520 12 10 (1) Ì Ì
Loss before cumulative eÅect of
accounting change ÏÏÏÏÏÏÏÏÏÏ (2,248) (1,157) (858) (66) Ì (17)
Cumulative eÅect of accounting
changeÏÏÏÏÏÏÏÏÏÏÏÏÏÏÏÏÏÏÏÏ (266) (10) Ì Ì Ì Ì
Net loss ÏÏÏÏÏÏÏÏÏÏÏÏÏÏÏÏÏÏÏÏ (2,514) (1,167) (858) (66) Ì (17)
Dividends on preferred stock ÏÏÏ (3) (1) Ì Ì Ì Ì
Net loss applicable to common
stock ÏÏÏÏÏÏÏÏÏÏÏÏÏÏÏÏÏÏÏÏÏ $ (2,517) (1,168) (858)$ (66) Ì $(17)
Loss per common share, basic
and diluted ÏÏÏÏÏÏÏÏÏÏÏÏÏÏÏÏ $ (8.55)$ (4.33)$ (3.80)$ (2.22) $ (0.04) N/A
Weighted-average common
shares outstanding ÏÏÏÏÏÏÏÏÏÏ 294,440,261 269,594,386 225,697,775 29,811,202 50,000 N/A
Balance Sheet Data (end of
period):
Total assetsÏÏÏÏÏÏÏÏÏÏÏÏÏÏÏÏÏÏ $ 22,384 $ 26,463 $ 24,352 $ 18,967 $ 4,336 $282
Long-term debt ÏÏÏÏÏÏÏÏÏÏÏÏÏÏ 18,671 16,343 13,061 8,937 2,002 275
Minority interest ÏÏÏÏÏÏÏÏÏÏÏÏÏ 1,025 4,409 4,546 5,381 2,147 Ì
Redeemable securitiesÏÏÏÏÏÏÏÏÏ Ì Ì 1,104 751 Ì Ì
Preferred stock Ì redeemableÏÏ 51 51 Ì Ì Ì Ì
Shareholders' equity/Members'
equity (deÑcit)ÏÏÏÏÏÏÏÏÏÏÏÏÏ 41 2,585 2,767 3,011 1 (8)
12