Charter 2011 Annual Report Download - page 110
Download and view the complete annual report
Please find page 110 of the 2011 Charter annual report below. You can navigate through the pages in the report by either clicking on the pages listed below, or by using the keyword search tool below to find specific information within the annual report.-
 1
1 -
2
-
3
-
4
-
5
-
6
-
7
-
8
-
9
-
10
-
11
-
12
-
13
-
14
-
15
-
16
-
17
-
18
-
19
-
20
-
21
-
22
-
23
-
24
-
25
-
26
-
27
-
28
-
29
-
30
-
31
-
32
-
33
-
34
-
35
-
36
-
37
-
38
-
39
-
40
-
41
-
42
-
43
-
44
-
45
-
46
-
47
-
48
-
49
-
50
-
51
-
52
-
53
-
54
-
55
-
56
-
57
-
58
-
59
-
60
-
61
-
62
-
63
-
64
-
65
-
66
-
67
-
68
-
69
-
70
-
71
-
72
-
73
-
74
-
75
-
76
-
77
-
78
-
79
-
80
-
81
-
82
-
83
-
84
-
85
-
86
-
87
-
88
-
89
-
90
-
91
-
92
-
93
-
94
-
95
-
96
-
97
-
98
-
99
-
 100
100 -
 101
101 -
 102
102 -
 103
103 -
 104
104 -
 105
105 -
 106
106 -
 107
107 -
 108
108 -
 109
109 -
 110
110 -
 111
111 -
 112
112 -
 113
113 -
 114
114 -
 115
115 -
 116
116 -
 117
117 -
 118
118 -
 119
119 -
 120
120 -
121
-
122
-
123
-
124
-
125
-
126
-
127
-
128
-
129
-
130
-
131
-
132
-
133
-
134
-
135
-
136
-
137
-
138
-
139
-
140
-
141
 |
 |

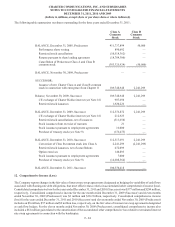
CHARTER COMMUNICATIONS, INC. AND SUBSIDIARIES
NOTES TO CONSOLIDATED FINANCIAL STATEMENTS
DECEMBER 31, 2011, 2010 AND 2009
(dollars in millions, except share or per share data or where indicated)
F- 26
other terms of the contracts.
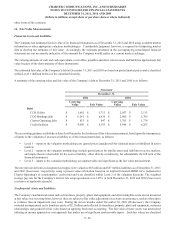
14. Fair Value Measurements
Financial Assets and Liabilities
The Company has estimated the fair value of its financial instruments as of December 31, 2011 and 2010 using available market
information or other appropriate valuation methodologies. Considerable judgment, however, is required in interpreting market
data to develop the estimates of fair value. Accordingly, the estimates presented in the accompanying consolidated financial
statements are not necessarily indicative of the amounts the Company would realize in a current market exchange.
The carrying amounts of cash and cash equivalents, receivables, payables and other current assets and liabilities approximate fair
value because of the short maturity of those instruments.
The estimated fair value of the Company’s debt at December 31, 2011 and 2010 are based on quoted market prices and is classified
within Level 1 (defined below) of the valuation hierarchy.
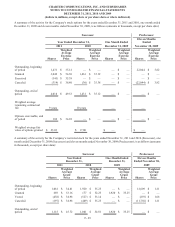
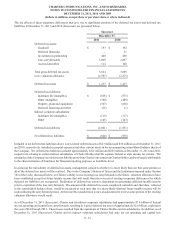
A summary of the carrying value and fair value of the Company’s debt at December 31, 2011 and 2010 is as follows:
Debt
CCH II debt
CCO Holdings debt
Charter Operating debt
Credit facilities
Successor
December 31,
2011
Carrying
Value
$ 1,692
$ 6,241
$ 833
$ 4,090
Fair Value
$ 1,713
$ 6,630
$ 847
$ 4,193
2010
Carrying
Value
$ 2,057
$ 2,600
$ 1,703
$ 5,946
Fair Value
$ 2,113
$ 2,709
$ 1,774
$ 6,252
The accounting guidance establishes a three-level hierarchy for disclosure of fair value measurements, based upon the transparency
of inputs to the valuation of an asset or liability as of the measurement date, as follows:
• Level 1 – inputs to the valuation methodology are quoted prices (unadjusted) for identical assets or liabilities in active
markets.
• Level 2 – inputs to the valuation methodology include quoted prices for similar assets and liabilities in active markets,
and inputs that are observable for the asset or liability, either directly or indirectly, for substantially the full term of the
financial instrument.
• Level 3 – inputs to the valuation methodology are unobservable and significant to the fair value measurement.
The interest rate derivatives designated as hedges were valued as $65 million and $57 million liabilities as of December 31, 2011
and 2010 (Successor), respectively, using a present value calculation based on an implied forward LIBOR curve (adjusted for
Charter Operating’s or counterparties’ credit risk) and were classified within Level 2 of the valuation hierarchy. The weighted
average pay rate for the Company’s interest rate swap agreements was 2.25% at both December 31, 2011 and 2010 (Successor)
(exclusive of applicable spreads).
Nonfinancial Assets and Liabilities
The Company’s nonfinancial assets such as franchises, property, plant, and equipment, and other intangible assets are not measured
at fair value on a recurring basis; however they are subject to fair value adjustments in certain circumstances, such as when there
is evidence that an impairment may exist. During the eleven months ended November 30, 2009 (Predecessor), the Company
recorded an impairment on its franchise assets of $2.2 billion and reflected its franchises, property, plant and equipment, customer
relationships and goodwill at fair value based on applying fresh start accounting. The fair value of these assets was determined
utilizing an income approach or cost approach that makes use of significant unobservable inputs. Such fair values are classified