Charter 2011 Annual Report Download - page 54
Download and view the complete annual report
Please find page 54 of the 2011 Charter annual report below. You can navigate through the pages in the report by either clicking on the pages listed below, or by using the keyword search tool below to find specific information within the annual report.-
 1
1 -
2
-
3
-
4
-
5
-
6
-
7
-
8
-
9
-
10
-
11
-
12
-
13
-
14
-
15
-
16
-
17
-
18
-
19
-
20
-
21
-
22
-
23
-
24
-
25
-
26
-
27
-
28
-
29
-
30
-
31
-
32
-
33
-
34
-
35
-
36
-
37
-
38
-
39
-
40
-
41
-
42
-
43
-
 44
44 -
 45
45 -
 46
46 -
 47
47 -
 48
48 -
 49
49 -
 50
50 -
 51
51 -
 52
52 -
 53
53 -
 54
54 -
 55
55 -
 56
56 -
 57
57 -
 58
58 -
 59
59 -
 60
60 -
 61
61 -
 62
62 -
 63
63 -
 64
64 -
65
-
66
-
67
-
68
-
69
-
70
-
71
-
72
-
73
-
74
-
75
-
76
-
77
-
78
-
79
-
80
-
81
-
82
-
83
-
84
-
85
-
86
-
87
-
88
-
89
-
90
-
91
-
92
-
93
-
94
-
95
-
96
-
97
-
98
-
99
-
100
-
101
-
102
-
103
-
104
-
105
-
106
-
107
-
108
-
109
-
110
-
111
-
112
-
113
-
114
-
115
-
116
-
117
-
118
-
119
-
120
-
121
-
122
-
123
-
124
-
125
-
126
-
127
-
128
-
129
-
130
-
131
-
132
-
133
-
134
-
135
-
136
-
137
-
138
-
139
-
140
-
141
 |
 |

42
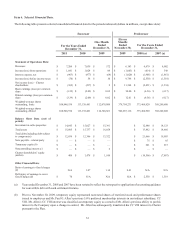
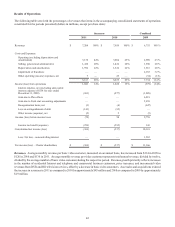
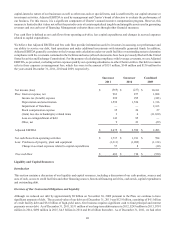
Results of Operations
The following table sets forth the percentages of revenues that items in the accompanying consolidated statements of operations
constituted for the periods presented (dollars in millions, except per share data):
Revenues
Costs and Expenses:
Operating (excluding depreciation and
amortization)
Selling, general and administrative
Depreciation and amortization
Impairment of franchises
Other operating (income) expenses, net
Income (loss) from operations
Interest expense, net (excluding unrecorded
interest expense of $558 for year ended
December 31, 2009)
Gain due to Plan effects
Gain due to fresh start accounting adjustments
Reorganization items, net
Loss on extinguishment of debt
Other income (expense), net
Income (loss) before income taxes
Income tax benefit (expense)
Consolidated net income (loss)
Less: Net loss – noncontrolling interest
Net income (loss) – Charter shareholders
Successor
2011
$ 7,204
3,138
1,426
1,592
—
7
6,163
1,041
(963)
—
—
(3)
(143)
(2)
(70)
(299)
(369)
—
$ (369)
100%
44%
20%
22%
—
—
86%
14%
2010
$ 7,059
3,064
1,422
1,524
—
25
6,035
1,024
(877)
—
—
(6)
(85)
2
58
(295)
(237)
—
$ (237)
100%
43%
20%
22%
—
—
85%
15%
Combined
2009
$ 6,755
2,909
1,380
1,316
2,163
(34)
7,734
(979)
(1,088)
6,818
5,659
(647)
—
(5)
9,758
343
10,101
1,265
$ 11,366
100 %
43 %
20 %
20 %
32 %
(1)%
114 %
(14)%
Revenues. Average monthly revenue per basic video customer, measured on an annual basis, has increased from $114 in 2009 to
$126 in 2010 and $136 in 2011. Average monthly revenue per video customer represents total annual revenue, divided by twelve,
divided by the average number of basic video customers during the respective period. Revenue growth primarily reflects increases
in the number of residential Internet and telephone and commercial business customers, price increases, and incremental video
revenues from DVR and HD television services, offset by a decrease in basic video customers. Asset sales and acquisitions reduced
the increase in revenues in 2011 as compared to 2010 by approximately $45 million and 2010 as compared to 2009 by approximately
$19 million.