Charter 2011 Annual Report Download - page 56
Download and view the complete annual report
Please find page 56 of the 2011 Charter annual report below. You can navigate through the pages in the report by either clicking on the pages listed below, or by using the keyword search tool below to find specific information within the annual report.-
 1
1 -
2
-
3
-
4
-
5
-
6
-
7
-
8
-
9
-
10
-
11
-
12
-
13
-
14
-
15
-
16
-
17
-
18
-
19
-
20
-
21
-
22
-
23
-
24
-
25
-
26
-
27
-
28
-
29
-
30
-
31
-
32
-
33
-
34
-
35
-
36
-
37
-
38
-
39
-
40
-
41
-
42
-
43
-
44
-
45
-
 46
46 -
 47
47 -
 48
48 -
 49
49 -
 50
50 -
 51
51 -
 52
52 -
 53
53 -
 54
54 -
 55
55 -
 56
56 -
 57
57 -
 58
58 -
 59
59 -
 60
60 -
 61
61 -
 62
62 -
 63
63 -
 64
64 -
 65
65 -
 66
66 -
67
-
68
-
69
-
70
-
71
-
72
-
73
-
74
-
75
-
76
-
77
-
78
-
79
-
80
-
81
-
82
-
83
-
84
-
85
-
86
-
87
-
88
-
89
-
90
-
91
-
92
-
93
-
94
-
95
-
96
-
97
-
98
-
99
-
100
-
101
-
102
-
103
-
104
-
105
-
106
-
107
-
108
-
109
-
110
-
111
-
112
-
113
-
114
-
115
-
116
-
117
-
118
-
119
-
120
-
121
-
122
-
123
-
124
-
125
-
126
-
127
-
128
-
129
-
130
-
131
-
132
-
133
-
134
-
135
-
136
-
137
-
138
-
139
-
140
-
141
 |
 |

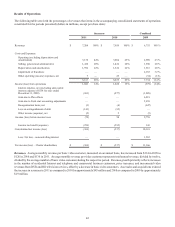
44
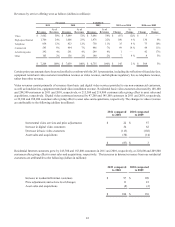
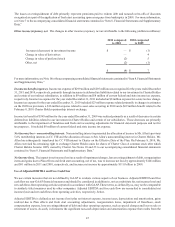
Residential telephone customers grew by 74,300 and 161,000 customers in 2011 and 2010, respectively, or 69,500 and 164,400
customers after giving effect to asset sales and acquisitions, respectively. The increases in telephone revenues from our residential
customers are attributable to the following (dollars in millions):
Increase in residential telephone customers
Price adjustments and service level changes
2011 compared
to 2010
$ 50
(15)
$ 35
2010 compared
to 2009
$ 102
(29)
$ 73
Average monthly revenue per telephone customer decreased during 2011 compared to 2010 and 2010 compared to 2009 due to
increased value based packages and bundling.
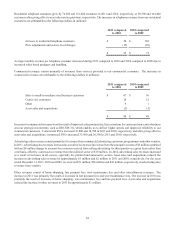
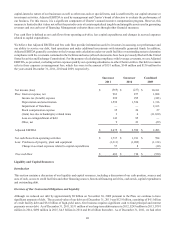
Commercial revenues consist primarily of revenues from services provided to our commercial customers. The increases in
commercial revenues are attributable to the following (dollars in millions):
Sales to small-to-medium sized business customers
Carrier site customers
Other
Asset sales and acquisitions
2011 compared
to 2010
$ 67
18
9
(5)
$ 89
2010 compared
to 2009
$ 36
12
1
(1)
$ 48
Increases in commercial revenues were the result of improved sales productivity, line extensions for carrier and non-carrier business
and our strategic investments, such as DOCSIS 3.0, which enables us to deliver higher speeds and improved reliability to our
commercial customers. Commercial PSUs increased 35,800 and 18,700 in 2011 and 2010, respectively, and after giving effect to
asset sales and acquisitions, commercial PSUs increased 35,900 and 26,300 in 2011 and 2010, respectively.
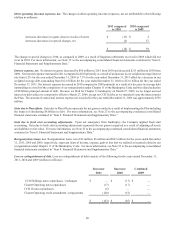
Advertising sales revenues consist primarily of revenues from commercial advertising customers, programmers and other vendors.
In 2011, advertising sales revenues increased as a result of an increase in revenue from the automotive sector of $3 million combined
with an $8 million change to account for revenues received from selling advertising for third parties on a gross basis rather than
a net basis, offset by a decrease in revenue from the political sector of $10 million. In 2010, advertising sales revenues increased
as a result of increases in all sectors, especially the political and automotive sectors. Asset sales and acquisitions reduced the
increase in advertising sales revenue by approximately $1 million and $2 million in 2011 and 2010, respectively. For the years
ended December 31, 2011, 2010 and 2009, we received $51 million, $46 million and $41 million, respectively, in advertising sales
revenues from vendors.
Other revenues consist of home shopping, late payment fees, wire maintenance fees and other miscellaneous revenues. The
increase in 2011 was primarily the result of increases in late payment fees and wire maintenance fees. The increase in 2010 was
primarily the result of increases in home shopping, wire maintenance fees and late payment fees. Asset sales and acquisitions
reduced the increase in other revenues in 2011 by approximately $1 million.