Charter 2011 Annual Report Download - page 45
Download and view the complete annual report
Please find page 45 of the 2011 Charter annual report below. You can navigate through the pages in the report by either clicking on the pages listed below, or by using the keyword search tool below to find specific information within the annual report.-
 1
1 -
2
-
3
-
4
-
5
-
6
-
7
-
8
-
9
-
10
-
11
-
12
-
13
-
14
-
15
-
16
-
17
-
18
-
19
-
20
-
21
-
22
-
23
-
24
-
25
-
26
-
27
-
28
-
29
-
30
-
31
-
32
-
33
-
34
-
 35
35 -
 36
36 -
 37
37 -
 38
38 -
 39
39 -
 40
40 -
 41
41 -
 42
42 -
 43
43 -
 44
44 -
 45
45 -
 46
46 -
 47
47 -
 48
48 -
 49
49 -
 50
50 -
 51
51 -
 52
52 -
 53
53 -
 54
54 -
 55
55 -
56
-
57
-
58
-
59
-
60
-
61
-
62
-
63
-
64
-
65
-
66
-
67
-
68
-
69
-
70
-
71
-
72
-
73
-
74
-
75
-
76
-
77
-
78
-
79
-
80
-
81
-
82
-
83
-
84
-
85
-
86
-
87
-
88
-
89
-
90
-
91
-
92
-
93
-
94
-
95
-
96
-
97
-
98
-
99
-
100
-
101
-
102
-
103
-
104
-
105
-
106
-
107
-
108
-
109
-
110
-
111
-
112
-
113
-
114
-
115
-
116
-
117
-
118
-
119
-
120
-
121
-
122
-
123
-
124
-
125
-
126
-
127
-
128
-
129
-
130
-
131
-
132
-
133
-
134
-
135
-
136
-
137
-
138
-
139
-
140
-
141
 |
 |

33
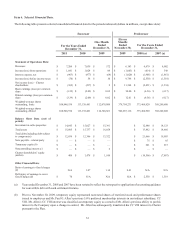
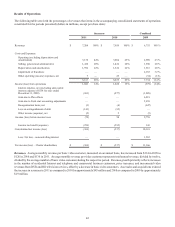
Item 6. Selected Financial Data.
The following table presents selected consolidated financial data for the periods indicated (dollars in millions, except share data):
Statement of Operations Data:
Revenues
Income (loss) from operations
Interest expense, net
Income (loss) before income taxes
Net income (loss) – Charter
shareholders
Basic earnings (loss) per common
share
Diluted earnings (loss) per common
share
Weighted-average shares
outstanding, basic
Weighted-average shares
outstanding, diluted
Balance Sheet Data (end of
period):
Investment in cable properties
Total assets
Total debt (including debt subject
to compromise)
Note payable – related party
Temporary equity (b)
Noncontrolling interest (c)
Charter shareholders’ equity
(deficit)
Other Financial Data:
Ratio of earnings to fixed charges
(d)
Deficiency of earnings to cover
fixed Charges (d)
Successor
For the Years Ended
December 31,
2011
$ 7,204
$ 1,041
$ (963)
$ (70)
$ (369)
$ (3.39)
$ (3.39)
108,948,554
108,948,554
$ 14,843
$ 15,605
$ 12,856
$ —
$ —
$ —
$ 409
N/A
$ 70
2010
$ 7,059
$ 1,024
$ (877)
$ 58
$ (237)
$ (2.09)
$ (2.09)
113,138,461
113,138,461
$ 15,027
$ 15,737
$ 12,306
$ —
$ —
$ —
$ 1,478
1.07
N/A
One Month
Ended
December 31,
2009
$ 572
$ 84
$ (68)
$ 10
$ 2
$ 0.02
$ 0.02
112,078,089
114,346,861
$ 15,391
$ 16,658
$ 13,322
$ —
$ —
$ 2
$ 1,916
1.14
N/A
Predecessor
Eleven
Months
Ended
November 30,
2009
$ 6,183
$ (1,063)
$ (1,020)
$ 9,748
$ 11,364
$ 30.00
$ 12.61
378,784,231
902,067,116
8.41
N/A
For the Years Ended
December 31,
2008 (a)
$ 6,479
$ (614)
$ (1,905)
$ (2,550)
$ (2,451)
$ (6.56)
$ (6.56)
373,464,920
373,464,920
$ 12,448
$ 13,882
$ 21,666
$ 75
$ 241
$ —
$ (10,506)
N/A
$ 2,550
2007 (a)
$ 6,002
$ 548
$ (1,861)
$ (1,318)
$ (1,534)
$ (4.17)
$ (4.17)
368,240,608
368,240,608
$ 14,123
$ 14,666
$ 19,903
$ 65
$ 215
$ —
$ (7,887)
N/A
$ 1,318
(a) Years ended December 31, 2008 and 2007 have been restated to reflect the retrospective application of accounting guidance
for convertible debt with cash settlement features.
(b) Prior to November 30, 2009, temporary equity represented nonvested shares of restricted stock and performance shares
issued to employees and Mr. Paul G. Allen’s previous 5.6% preferred membership interests in our indirect subsidiary, CC
VIII. Mr. Allen’s CC VIII interest was classified as temporary equity as a result of Mr. Allen’s previous ability to put his
interest to the Company upon a change in control. Mr. Allen has subsequently transferred his CC VIII interest to Charter
pursuant to the Plan.