Charter 2011 Annual Report Download - page 96
Download and view the complete annual report
Please find page 96 of the 2011 Charter annual report below. You can navigate through the pages in the report by either clicking on the pages listed below, or by using the keyword search tool below to find specific information within the annual report.-
 1
1 -
2
-
3
-
4
-
5
-
6
-
7
-
8
-
9
-
10
-
11
-
12
-
13
-
14
-
15
-
16
-
17
-
18
-
19
-
20
-
21
-
22
-
23
-
24
-
25
-
26
-
27
-
28
-
29
-
30
-
31
-
32
-
33
-
34
-
35
-
36
-
37
-
38
-
39
-
40
-
41
-
42
-
43
-
44
-
45
-
46
-
47
-
48
-
49
-
50
-
51
-
52
-
53
-
54
-
55
-
56
-
57
-
58
-
59
-
60
-
61
-
62
-
63
-
64
-
65
-
66
-
67
-
68
-
69
-
70
-
71
-
72
-
73
-
74
-
75
-
76
-
77
-
78
-
79
-
80
-
81
-
82
-
83
-
84
-
85
-
 86
86 -
 87
87 -
 88
88 -
 89
89 -
 90
90 -
 91
91 -
 92
92 -
 93
93 -
 94
94 -
 95
95 -
 96
96 -
 97
97 -
 98
98 -
 99
99 -
 100
100 -
 101
101 -
 102
102 -
 103
103 -
 104
104 -
 105
105 -
 106
106 -
107
-
108
-
109
-
110
-
111
-
112
-
113
-
114
-
115
-
116
-
117
-
118
-
119
-
120
-
121
-
122
-
123
-
124
-
125
-
126
-
127
-
128
-
129
-
130
-
131
-
132
-
133
-
134
-
135
-
136
-
137
-
138
-
139
-
140
-
141
 |
 |
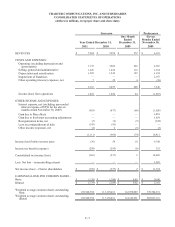
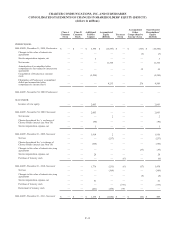
CHARTER COMMUNICATIONS, INC. AND SUBSIDIARIES
NOTES TO CONSOLIDATED FINANCIAL STATEMENTS
DECEMBER 31, 2011, 2010 AND 2009
(dollars in millions, except share or per share data or where indicated)
F- 12
Stock-Based Compensation
Restricted stock, restricted stock units, stock options and performance units and shares are measured at the grant date fair value
and amortized to stock compensation expense over the requisite service period. The Company recorded $41 million, $28 million,
$1 million and $26 million of stock compensation expense which is included in general and administrative expenses and other
operating expense (income), net for the years ended December 31, 2011 and 2010 (Successor), one month ended December 31,
2009 (Successor) and eleven months ended November 30, 2009 (Predecessor), respectively.
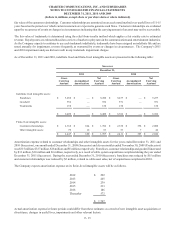
The fair value of options granted is estimated on the date of grant using the Black-Scholes option-pricing model and in 2011,
Monte Carlo simulations for options and restricted stock units with market conditions. The grant date weighted average assumptions
used during the years ended December 31, 2011 and 2010 (Successor), respectively, were: risk-free interest rate of 2.5%; expected
volatility of 38.4% and 47.7%, and expected lives of 6.6 years and 6.3 years. The grant date weighted average assumption for
cost of equity of the 2011 awards was 15.5%. Volatility assumptions were based on historical volatility of Charter and a peer group.
The Company’s volatility assumptions represent management’s best estimate and were partially based on historical volatility of
a peer group because management does not believe Charter’s pre-emergence historical volatility to be representative of its future
volatility. Expected lives were calculated based on the simplified-method due to insufficient historical exercise data. The valuations
assume no dividends are paid. The Company did not grant stock options in 2009.
Income Taxes
The Company recognizes deferred tax assets and liabilities for temporary differences between the financial reporting basis and
the tax basis of the Company’s assets and liabilities and expected benefits of utilizing loss carryforwards. The impact on deferred
taxes of changes in tax rates and tax law, if any, applied to the years during which temporary differences are expected to be settled,
are reflected in the consolidated financial statements in the period of enactment (see Note 18).
Earnings (Loss) per Common Share
Basic earnings (loss) per common share is computed by dividing the net income (loss) available to common shareholders by the
weighted-average common shares outstanding during the respective periods. Diluted loss per common share equals basic loss per
common share for the years ended December 31, 2011 and 2010 (Successor), as the effect of stock options and other convertible
securities are antidilutive because the Company incurred net losses. Diluted earnings per common share for the one month ended
December 31, 2009 (Successor) and eleven months ended November 30, 2009 (Predecessor) is based on the average number of
shares used for the basic earnings per common share calculation, adjusted for the dilutive effect of stock options and other convertible
securities (See Note 19). Predecessor shares were canceled on the Effective Date and shares of Successor were issued. As a result,
earnings (loss) per share information for the Successor is not comparable to the Predecessor loss per share.
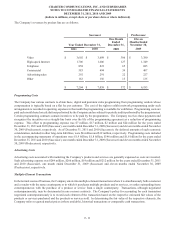
Segments
The Company’s operations are managed on the basis of geographic operating segments. The Company has evaluated the criteria
for aggregation of the geographic operating segments and believes it meets each of the respective criteria set forth. The Company
delivers similar products and services within each of its geographic operations. Each geographic service area utilizes similar
means for delivering the programming of the Company’s services; have similarity in the type or class of customer receiving the
products and services; distributes the Company’s services over a unified network; and operates within a consistent regulatory
environment. In addition, each of the geographic operating segments has similar economic characteristics. In light of the Company’s
similar services, means for delivery, similarity in type of customers, the use of a unified network and other considerations across
its geographic operating structure, management has determined that the Company has one reportable segment, broadband services.