Charter 2011 Annual Report Download - page 8
Download and view the complete annual report
Please find page 8 of the 2011 Charter annual report below. You can navigate through the pages in the report by either clicking on the pages listed below, or by using the keyword search tool below to find specific information within the annual report.-
 1
1 -
 2
2 -
 3
3 -
 4
4 -
 5
5 -
 6
6 -
 7
7 -
 8
8 -
 9
9 -
 10
10 -
 11
11 -
 12
12 -
 13
13 -
 14
14 -
 15
15 -
 16
16 -
 17
17 -
 18
18 -
 19
19 -
20
-
21
-
22
-
23
-
24
-
25
-
26
-
27
-
28
-
29
-
30
-
31
-
32
-
33
-
34
-
35
-
36
-
37
-
38
-
39
-
40
-
41
-
42
-
43
-
44
-
45
-
46
-
47
-
48
-
49
-
50
-
51
-
52
-
53
-
54
-
55
-
56
-
57
-
58
-
59
-
60
-
61
-
62
-
63
-
64
-
65
-
66
-
67
-
68
-
69
-
70
-
71
-
72
-
73
-
74
-
75
-
76
-
77
-
78
-
79
-
80
-
81
-
82
-
83
-
84
-
85
-
86
-
87
-
88
-
89
-
90
-
91
-
92
-
93
-
94
-
95
-
96
-
97
-
98
-
99
-
100
-
101
-
102
-
103
-
104
-
105
-
106
-
107
-
108
-
109
-
110
-
111
-
112
-
113
-
114
-
115
-
116
-
117
-
118
-
119
-
120
-
121
-
122
-
123
-
124
-
125
-
126
-
127
-
128
-
129
-
130
-
131
-
132
-
133
-
134
-
135
-
136
-
137
-
138
-
139
-
140
-
141
 |
 |

6Charter Communications, Inc. 2011 Annual Report
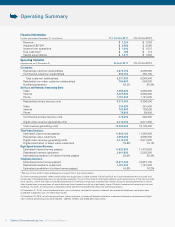
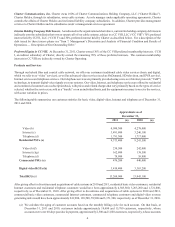
Financial Information
For the year ended December 31, (in millions) Pro Forma 2011 Pro Forma 2010
Revenue $ 7,224 $ 7,034
Adjusted EBIT DA* $ 2,680 $ 2,595
Income from operations $ 1,040 $ 1,015
Free cash flow* $ 488 $ 712
Capital expenditures $ 1,311 $ 1,203
Operating Statistics
Approximate as of December 31, Actual 2011 Pro Forma 2010
Customers:
Residential customer relationships 4,875,100 4,899,800
Commercial customer relationships 362,400 350,100
Total customer relationships 5,237,500 5,249,900
Residential non-video customer relationships 784,800 594,000
Bundled penetration 62.3% 60.8%
Services and Revenue Generating Units:
Video 4,090,300 4,305,800
Internet 3,491,800 3,263,200
Phone 1,791,300 1,721,800
Residential primary service units 9,373,400 9,290,800
Video 234,500 241,900
Internet 162,800 138,500
Phone 78,900 59,900
Commercial primary service units 476,200 440,300
Digital video revenue generating units 3,410,400 3,371,300
Total revenue generating units 13,260,000 13,102,400
Total Video Services:
Estimated video homes passed 11,960,100 11,842,900
Residential video customers 4,090,300 4,305,800
Digital video revenue generating units 3,410,400 3,371,300
Digital penetration of basic video customers 78.9% 74.1%
High-Speed Internet Services:
Estimated Internet homes passed 11,633,800 11,478,600
Residential Internet customers 3,491,800 3,263,200
Estimated penetration of Internet homes passed 30.0% 28.4%
Telephone Services:
Estimated phone homes passed 10,871,000 10,637,700
Residential telephone customers 1,791,300 1,721,800
Estimated penetration of phone homes passed 16.5% 16.2%
*See Use of Non-GAAP Financial Measures on page F-53 of this Annual Report.
Pro forma operating statistics reflect certain sales and acquisitions of cable systems in 2010 and 2011 as if such transactions had occurred as of
the last day of the respective period for all periods presented. The pro forma financial information reflects such transactions as if they had occurred
as of January 1, 2010 and does not include adjustments for financing transactions completed by Charter during the periods presented or certain
other dispositions or acquisitions of assets because those transactions did not significantly impact Charter’s revenue and operating costs and
expenses. However, all transactions completed in 2010 and 2011 have been reflected in the operating statistics.
At December 31, 2010, actual residential basic video customers, residential Internet customers and residential telephone customers were
4,278,400, 3,246,100, and 1,717,000, respectively.
At December 31, 2010, actual commercial basic video customers, commercial Internet customers, commercial telephone customers and digital
video revenue generating units were 242,000, 138,500, 59,900, and 3,363,200, respectively.
Operating Summary
➥