Charter 2011 Annual Report Download - page 55
Download and view the complete annual report
Please find page 55 of the 2011 Charter annual report below. You can navigate through the pages in the report by either clicking on the pages listed below, or by using the keyword search tool below to find specific information within the annual report.-
 1
1 -
2
-
3
-
4
-
5
-
6
-
7
-
8
-
9
-
10
-
11
-
12
-
13
-
14
-
15
-
16
-
17
-
18
-
19
-
20
-
21
-
22
-
23
-
24
-
25
-
26
-
27
-
28
-
29
-
30
-
31
-
32
-
33
-
34
-
35
-
36
-
37
-
38
-
39
-
40
-
41
-
42
-
43
-
44
-
 45
45 -
 46
46 -
 47
47 -
 48
48 -
 49
49 -
 50
50 -
 51
51 -
 52
52 -
 53
53 -
 54
54 -
 55
55 -
 56
56 -
 57
57 -
 58
58 -
 59
59 -
 60
60 -
 61
61 -
 62
62 -
 63
63 -
 64
64 -
 65
65 -
66
-
67
-
68
-
69
-
70
-
71
-
72
-
73
-
74
-
75
-
76
-
77
-
78
-
79
-
80
-
81
-
82
-
83
-
84
-
85
-
86
-
87
-
88
-
89
-
90
-
91
-
92
-
93
-
94
-
95
-
96
-
97
-
98
-
99
-
100
-
101
-
102
-
103
-
104
-
105
-
106
-
107
-
108
-
109
-
110
-
111
-
112
-
113
-
114
-
115
-
116
-
117
-
118
-
119
-
120
-
121
-
122
-
123
-
124
-
125
-
126
-
127
-
128
-
129
-
130
-
131
-
132
-
133
-
134
-
135
-
136
-
137
-
138
-
139
-
140
-
141
 |
 |

43
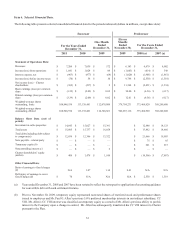
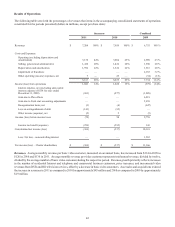
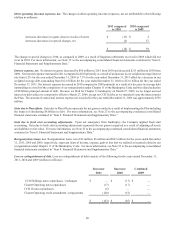
Revenues by service offering were as follows (dollars in millions):
Video
High-speed Internet
Telephone
Commercial
Advertising sales
Other
Successor
2011
Revenues
$ 3,602
1,706
858
583
292
163
$ 7,204
% of
Revenues
50%
24%
12%
8%
4%
2%
100%
2010
Revenues
$ 3,689
1,606
823
494
291
156
$ 7,059
% of
Revenues
52%
23%
12%
7%
4%
2%
100%
Combined
2009
Revenues
$ 3,686
1,476
750
446
249
148
$ 6,755
% of
Revenues
54%
22%
11%
7%
4%
2%
100%
2011 over 2010
Change
$ (87)
100
35
89
1
7
$ 145
%
Change
(2)%
6 %
4 %
18 %
—
4 %
2 %
2010 over 2009
Change
$ 3
130
73
48
42
8
$ 304
%
Change
—
9%
10%
11%
17%
5%
5%
Certain prior year amounts have been reclassified to conform with the 2011 presentation, including the reflection of franchise fees,
equipment rental and video customer installation revenue as video revenue, and telephone regulatory fees as telephone revenue,
rather than other revenue.
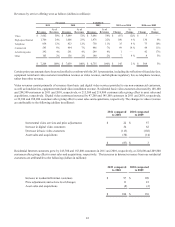
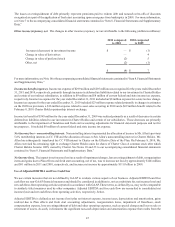
Video revenues consist primarily of revenues from basic and digital video services provided to our non-commercial customers,
as well as franchise fees, equipment rental and video installation revenue. Residential basic video customers decreased by 188,100
and 284,500 customers in 2011 and 2010, respectively, or 215,500 and 214,800 customers after giving effect to asset sales and
acquisitions, respectively. Digital video customers increased by 47,200 and 145,100 customers in 2011 and 2010, respectively,
or 39,100 and 188,200 customers after giving effect to asset sales and acquisitions, respectively. The changes in video revenues
are attributable to the following (dollars in millions):
Incremental video services and price adjustments
Increase in digital video customers
Decrease in basic video customers
Asset sales and acquisitions
2011 compared
to 2010
$ 22
34
(113)
(30)
$(87)
2010 compared
to 2009
$ 57
62
(102)
(14)
$ 3
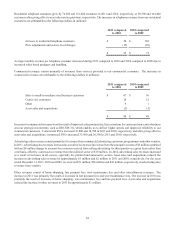
Residential Internet customers grew by 245,700 and 183,800 customers in 2011 and 2010, respectively, or 228,600 and 209,800
customers after giving effect to asset sales and acquisitions, respectively. The increases in Internet revenues from our residential
customers are attributable to the following (dollars in millions):
Increase in residential Internet customers
Price adjustments and service level changes
Asset sales and acquisitions
2011 compared
to 2010
$ 97
11
(8)
$ 100
2010 compared
to 2009
$ 109
23
(2)
$ 130