Charter 2011 Annual Report Download - page 64
Download and view the complete annual report
Please find page 64 of the 2011 Charter annual report below. You can navigate through the pages in the report by either clicking on the pages listed below, or by using the keyword search tool below to find specific information within the annual report.-
 1
1 -
2
-
3
-
4
-
5
-
6
-
7
-
8
-
9
-
10
-
11
-
12
-
13
-
14
-
15
-
16
-
17
-
18
-
19
-
20
-
21
-
22
-
23
-
24
-
25
-
26
-
27
-
28
-
29
-
30
-
31
-
32
-
33
-
34
-
35
-
36
-
37
-
38
-
39
-
40
-
41
-
42
-
43
-
44
-
45
-
46
-
47
-
48
-
49
-
50
-
51
-
52
-
53
-
 54
54 -
 55
55 -
 56
56 -
 57
57 -
 58
58 -
 59
59 -
 60
60 -
 61
61 -
 62
62 -
 63
63 -
 64
64 -
 65
65 -
 66
66 -
 67
67 -
 68
68 -
 69
69 -
 70
70 -
 71
71 -
 72
72 -
 73
73 -
 74
74 -
75
-
76
-
77
-
78
-
79
-
80
-
81
-
82
-
83
-
84
-
85
-
86
-
87
-
88
-
89
-
90
-
91
-
92
-
93
-
94
-
95
-
96
-
97
-
98
-
99
-
100
-
101
-
102
-
103
-
104
-
105
-
106
-
107
-
108
-
109
-
110
-
111
-
112
-
113
-
114
-
115
-
116
-
117
-
118
-
119
-
120
-
121
-
122
-
123
-
124
-
125
-
126
-
127
-
128
-
129
-
130
-
131
-
132
-
133
-
134
-
135
-
136
-
137
-
138
-
139
-
140
-
141
 |
 |
52
to meet these tests at the time of the contemplated distribution. In the past, certain subsidiaries have from time to time failed to
meet their leverage ratio test. There can be no assurance that they will satisfy these tests at the time of the contemplated distribution.
Distributions by Charter Operating for payment of principal on parent company notes are further restricted by the covenants in its
credit facilities.
Distributions by CCO Holdings and Charter Operating to a parent company for payment of parent company interest are permitted
if there is no default under the aforementioned indentures and CCO Holdings and Charter Operating credit facilities.
In addition to the limitation on distributions under the various indentures discussed above, distributions by our subsidiaries may
be limited by applicable law, including the Delaware Limited Liability Company Act, under which our subsidiaries may only make
distributions if they have “surplus” as defined in the act. See “Part I. Item 1A. Risk Factors —Restrictions in our subsidiaries’
debt instruments and under applicable law limit their ability to provide funds to us or our subsidiaries that are debt issuers.”
Historical Operating, Investing, and Financing Activities
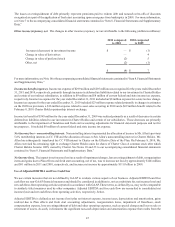
Cash and Cash Equivalents. We held $29 million and $32 million in cash and cash equivalents, including $27 million and $28
million of restricted cash, as of December 31, 2011 and 2010, respectively.
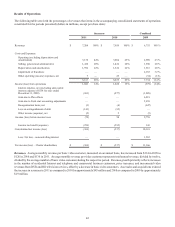
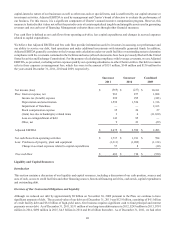
Operating Activities. Net cash provided by operating activities decreased $174 million from $1.9 billion for the year ended
December 31, 2010 to $1.7 billion for the year ended December 31, 2011, primarily as a result of an increase of $164 million in
cash paid for interest. The increase in interest payments was primarily related to higher interest rates as part of refinancing, net
of timing of interest payments. Excluding the change in accrued interest and in liabilities related to capital expenditures, changes
in operating assets and liabilities provided $91 million less cash during 2011 driven by one-time benefits in the first half of 2010
post emergence from bankruptcy along with timing of payments in 2011. These decreases in cash provided by operating activities
were offset by revenues increasing at a faster rate than cash expenses.
Net cash provided by operating activities increased $1.3 billion from $594 million for the year ended December 31, 2009 to $1.9
billion for the year ended December 31, 2010, primarily as the result of a decrease of $495 million in cash paid for a swap termination
liability, $365 million in cash paid for interest, $182 million in cash paid for reorganization items other than interest, changes in
operating assets and liabilities, excluding the change in accrued interest and in liabilities related to capital expenditures, that
provided $224 million more cash during the same period, and revenues increasing at a faster rate than cash expenses.
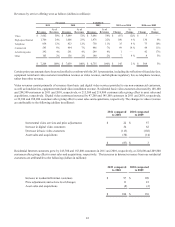
Investing Activities. Net cash used in investing activities for the years ended December 31, 2011, 2010 and 2009, was $1.4 billion,
$1.2 billion and $1.3 billion, respectively. The increase in 2011 compared to 2010 is primarily due to an increase of $102 million
in purchases of property, plant and equipment as a result of capital investments to enhance our residential and commercial products
and services capabilities and $89 million related to our purchase of cable systems. The decrease in 2010 compared to 2009 is
primarily due to the purchase of the CC VIII interest in 2009 in connection with the Plan, offset by an increase of $75 million in
purchases of property, plant and equipment as a result of capital investments to enhance our residential and commercial products
and services capabilities.
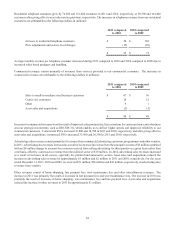
Financing Activities. Net cash used in financing activities was $373 million and $1.5 billion for the years ended December 31,
2011 and 2010, respectively, and net cash provided by financing activities was $504 million for the year ended December 31,
2009. The decrease in cash used during the year ended December 31, 2011 as compared to the corresponding period in 2010, was
primarily the result of increased borrowings of long-term debt, offset by increased repayments of long-term debt and purchase of
treasury stock. The increase in cash used during the year ended December 31, 2010 compared to the corresponding period in 2009
was primarily due to increased repayments of long-term debt and repayment of preferred stock, offset by borrowings of long-term
debt.
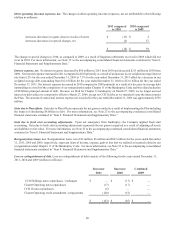
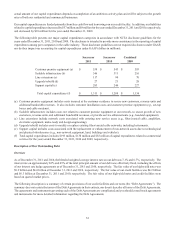
Capital Expenditures
We have significant ongoing capital expenditure requirements. Capital expenditures were $1.3 billion, $1.2 billion and $1.1 billion
for the years ended December 31, 2011, 2010 and 2009, respectively. The increases are a result of investments in our sales and
product capabilities, primarily through deployment of SDV and DOCSIS 3.0, extending our network to serve new commercial
customers and incremental capital for storm-related damage in 2011. See the table below for more details.
During 2012, we currently expect capital expenditures to be between $1.4 billion and $1.5 billion. The higher anticipated
expenditures in 2012 relate to accelerated plans for commercial and residential customer growth, investments in our video product
to provide for additional HD channels, and further investments in the customer experience, both in systems and the network. The