Charter 2011 Annual Report Download - page 60
Download and view the complete annual report
Please find page 60 of the 2011 Charter annual report below. You can navigate through the pages in the report by either clicking on the pages listed below, or by using the keyword search tool below to find specific information within the annual report.-
 1
1 -
2
-
3
-
4
-
5
-
6
-
7
-
8
-
9
-
10
-
11
-
12
-
13
-
14
-
15
-
16
-
17
-
18
-
19
-
20
-
21
-
22
-
23
-
24
-
25
-
26
-
27
-
28
-
29
-
30
-
31
-
32
-
33
-
34
-
35
-
36
-
37
-
38
-
39
-
40
-
41
-
42
-
43
-
44
-
45
-
46
-
47
-
48
-
49
-
 50
50 -
 51
51 -
 52
52 -
 53
53 -
 54
54 -
 55
55 -
 56
56 -
 57
57 -
 58
58 -
 59
59 -
 60
60 -
 61
61 -
 62
62 -
 63
63 -
 64
64 -
 65
65 -
 66
66 -
 67
67 -
 68
68 -
 69
69 -
 70
70 -
71
-
72
-
73
-
74
-
75
-
76
-
77
-
78
-
79
-
80
-
81
-
82
-
83
-
84
-
85
-
86
-
87
-
88
-
89
-
90
-
91
-
92
-
93
-
94
-
95
-
96
-
97
-
98
-
99
-
100
-
101
-
102
-
103
-
104
-
105
-
106
-
107
-
108
-
109
-
110
-
111
-
112
-
113
-
114
-
115
-
116
-
117
-
118
-
119
-
120
-
121
-
122
-
123
-
124
-
125
-
126
-
127
-
128
-
129
-
130
-
131
-
132
-
133
-
134
-
135
-
136
-
137
-
138
-
139
-
140
-
141
 |
 |

48
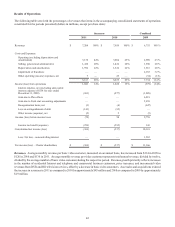
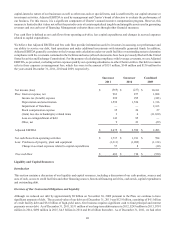
capital-intensive nature of our businesses as well as other non-cash or special items, and is unaffected by our capital structure or
investment activities. Adjusted EBITDA is used by management and Charter’s board of directors to evaluate the performance of
our business. For this reason, it is a significant component of Charter’s annual incentive compensation program. However, this
measure is limited in that it does not reflect the periodic costs of certain capitalized tangible and intangible assets used in generating
revenues and our cash cost of financing. Management evaluates these costs through other financial measures.
Free cash flow is defined as net cash flows from operating activities, less capital expenditures and changes in accrued expenses
related to capital expenditures.
We believe that Adjusted EBITDA and free cash flow provide information useful to investors in assessing our performance and
our ability to service our debt, fund operations and make additional investments with internally generated funds. In addition,
Adjusted EBITDA generally correlates to the leverage ratio calculation under our credit facilities or outstanding notes to determine
compliance with the covenants contained in the facilities and notes (all such documents have been previously filed with the United
States Securities and Exchange Commission). For the purpose of calculating compliance with leverage covenants, we use Adjusted
EBITDA, as presented, excluding certain expenses paid by our operating subsidiaries to other Charter entities. Our debt covenants
refer to these expenses as management fees, which fees were in the amount of $151 million, $144 million and $136 million for
the years ended December 31, 2011, 2010 and 2009, respectively.
Net income (loss)
Plus: Interest expense, net
Income tax (benefit) expense
Depreciation and amortization
Impairment of franchises
Stock compensation expense
(Gain) loss due to bankruptcy related items
Loss on extinguishment of debt
Other, net
Adjusted EBITDA
Net cash flows from operating activities
Less: Purchases of property, plant and equipment
Change in accrued expenses related to capital expenditures
Free cash flow
Successor
2011
$(369)
963
299
1,592
—
35
3
143
9
$ 2,675
$ 1,737
(1,311)
57
$ 483
Successor
2010
$(237)
877
295
1,524
—
26
6
85
23
$ 2,599
$ 1,911
(1,209)
8
$ 710
Combined
2009
$ 10,101
1,088
(343)
1,316
2,163
27
(11,830)
—
(29)
$ 2,493
$ 594
(1,134)
(10)
$(550)
Liquidity and Capital Resources
Introduction
This section contains a discussion of our liquidity and capital resources, including a discussion of our cash position, sources and
uses of cash, access to credit facilities and other financing sources, historical financing activities, cash needs, capital expenditures
and outstanding debt.
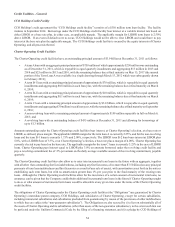
Overview of Our Contractual Obligations and Liquidity
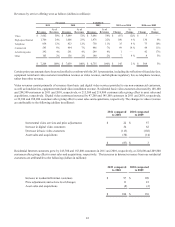
Although we reduced our debt by approximately $8 billion on November 30, 2009 pursuant to the Plan, we continue to have
significant amounts of debt. The accreted value of our debt as of December 31, 2011 was $12.9 billion, consisting of $4.1 billion
of credit facility debt and $8.8 billion of high-yield notes. Our business requires significant cash to fund principal and interest
payments on our debt. As of December 31, 2011, $531 million of our long-term debt matures in 2012, $243 million in 2013, $791
million in 2014, $490 million in 2015, $4.3 billion in 2016 and $6.4 billion thereafter. As of December 31, 2011, we had other