Charter 2011 Annual Report Download - page 57
Download and view the complete annual report
Please find page 57 of the 2011 Charter annual report below. You can navigate through the pages in the report by either clicking on the pages listed below, or by using the keyword search tool below to find specific information within the annual report.-
 1
1 -
2
-
3
-
4
-
5
-
6
-
7
-
8
-
9
-
10
-
11
-
12
-
13
-
14
-
15
-
16
-
17
-
18
-
19
-
20
-
21
-
22
-
23
-
24
-
25
-
26
-
27
-
28
-
29
-
30
-
31
-
32
-
33
-
34
-
35
-
36
-
37
-
38
-
39
-
40
-
41
-
42
-
43
-
44
-
45
-
46
-
 47
47 -
 48
48 -
 49
49 -
 50
50 -
 51
51 -
 52
52 -
 53
53 -
 54
54 -
 55
55 -
 56
56 -
 57
57 -
 58
58 -
 59
59 -
 60
60 -
 61
61 -
 62
62 -
 63
63 -
 64
64 -
 65
65 -
 66
66 -
 67
67 -
68
-
69
-
70
-
71
-
72
-
73
-
74
-
75
-
76
-
77
-
78
-
79
-
80
-
81
-
82
-
83
-
84
-
85
-
86
-
87
-
88
-
89
-
90
-
91
-
92
-
93
-
94
-
95
-
96
-
97
-
98
-
99
-
100
-
101
-
102
-
103
-
104
-
105
-
106
-
107
-
108
-
109
-
110
-
111
-
112
-
113
-
114
-
115
-
116
-
117
-
118
-
119
-
120
-
121
-
122
-
123
-
124
-
125
-
126
-
127
-
128
-
129
-
130
-
131
-
132
-
133
-
134
-
135
-
136
-
137
-
138
-
139
-
140
-
141
 |
 |

45
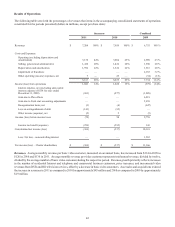
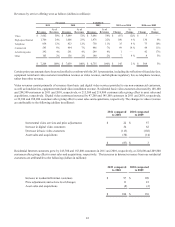
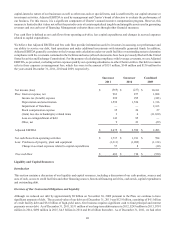
Operating expenses. The increases in our operating expenses are attributable to the following (dollars in millions):
Programming costs
Service labor costs
Vehicle costs
Commercial services
Franchise and regulatory fees
Other, net
Asset sales and acquisitions
2011 compared
to 2010
$ 73
23
8
3
(6)
(2)
(25)
$ 74
2010 compared
to 2009
$ 82
38
6
10
16
11
(8)
$ 155
Programming costs were approximately $1.9 billion, $1.8 billion and $1.7 billion, representing 60%, 59% and 60% of total operating
expenses for the years ended December 31, 2011, 2010 and 2009, respectively. Programming costs consist primarily of costs paid
to programmers for basic, premium, digital, OnDemand, and pay-per-view programming. The increases in programming costs
are primarily a result of annual contractual rate adjustments, offset in part by asset sales and customer losses. Programming costs
were also offset by the amortization of payments received from programmers of $7 million, $17 million and $26 million in 2011,
2010 and 2009, respectively. We expect programming expenses to continue to increase due to a variety of factors, including
amounts paid for retransmission consent, annual increases imposed by programmers, and additional programming, including new
sports services and non-linear programming for on-line and OnDemand programming.
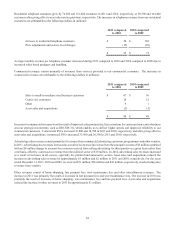
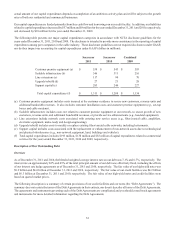
Selling, general and administrative expenses. The increases in selling, general and administrative expenses are attributable to
the following (dollars in millions):
Marketing costs
Stock compensation
Commercial services
Bad debt and collection costs
Other, net
Asset sales and acquisitions
2011 compared
to 2010
$ 19
9
7
(17)
(3)
(11)
$ 4
2010 compared
to 2009
$ 15
(1)
22
3
8
(5)
$ 42
The increase in marketing costs for the year ended December 31, 2011 is the result of increased brand and media investment,
channel development and increased marketing efforts for commercial and was offset by approximately $7 million of favorable
adjustments related to expenses previously accrued on 2010 marketing campaigns. The decrease in bad debt and collection costs
for the year ended December 31, 2011 is primarily due to a decrease in write-offs with a focus on the customer lifetime value of
connects. We can not assure you that this trend will continue.
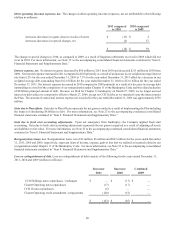
Depreciation and amortization. Depreciation and amortization expense increased by $68 million and $208 million in 2011 and
2010, respectively. The increase in 2011 compared to 2010 primarily represents depreciation on more recent capital expenditures,
offset by certain assets becoming fully depreciated. The increase in 2010 compared to 2009 was primarily the result of increased
amortization associated with the increase in customer relationships as a part of applying fresh start accounting offset by asset sales.
Impairment of franchises. We recorded impairment of $2.2 billion for the year ended December 31, 2009. The impairment recorded
in 2009 was a result of the continued economic pressure on our customers from the economic downturn along with increased
competition and the related impact to our projected future growth rates. The valuations completed in 2011 and 2010 showed
franchise values in excess of book value, and thus resulted in no impairment.