Charter 2011 Annual Report Download - page 5
Download and view the complete annual report
Please find page 5 of the 2011 Charter annual report below. You can navigate through the pages in the report by either clicking on the pages listed below, or by using the keyword search tool below to find specific information within the annual report.-
 1
1 -
 2
2 -
 3
3 -
 4
4 -
 5
5 -
 6
6 -
 7
7 -
 8
8 -
 9
9 -
 10
10 -
 11
11 -
 12
12 -
 13
13 -
 14
14 -
 15
15 -
 16
16 -
17
-
18
-
19
-
20
-
21
-
22
-
23
-
24
-
25
-
26
-
27
-
28
-
29
-
30
-
31
-
32
-
33
-
34
-
35
-
36
-
37
-
38
-
39
-
40
-
41
-
42
-
43
-
44
-
45
-
46
-
47
-
48
-
49
-
50
-
51
-
52
-
53
-
54
-
55
-
56
-
57
-
58
-
59
-
60
-
61
-
62
-
63
-
64
-
65
-
66
-
67
-
68
-
69
-
70
-
71
-
72
-
73
-
74
-
75
-
76
-
77
-
78
-
79
-
80
-
81
-
82
-
83
-
84
-
85
-
86
-
87
-
88
-
89
-
90
-
91
-
92
-
93
-
94
-
95
-
96
-
97
-
98
-
99
-
100
-
101
-
102
-
103
-
104
-
105
-
106
-
107
-
108
-
109
-
110
-
111
-
112
-
113
-
114
-
115
-
116
-
117
-
118
-
119
-
120
-
121
-
122
-
123
-
124
-
125
-
126
-
127
-
128
-
129
-
130
-
131
-
132
-
133
-
134
-
135
-
136
-
137
-
138
-
139
-
140
-
141
 |
 |

While predominately known for residential services, Charter offers a robust portfolio of
commercial communications services. Serving businesses of all sizes, we’ll continue
to expand our commercial product offering with advanced phone services, enhanced
Ethernet connectivity, and carrier-class backhaul and last-mile access services.
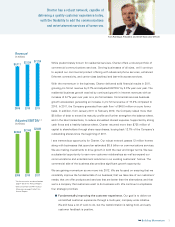
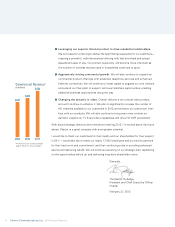
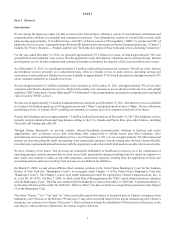
With the momentum in the business, Charter delivered solid financial results in 2011,
growing pro forma1 revenue by 2.7% and adjusted EBITDA2 by 3.3% year over year. The
residential business growth was led by continued growth in Internet revenues with an
increase of 6.7% year over year on a pro forma basis. Commercial services business
growth accelerated, generating an increase in pro forma revenue of 19.2% compared to
2010. In 2011, the Company generated free cash flow2 of $488 million on a pro forma
basis. In addition, from January 2011 to February 2012, the Company raised more than
$5 billion of debt to extend its maturity profile and further strengthen the balance sheet,
and in the later transactions, to reduce annualized interest expense. Supported by strong
cash flows and a healthy balance sheet, Charter returned more than $725 million of
capital to shareholders through share repurchases, buying back 12.7% of the Company’s
outstanding shares since the beginning of 2011.
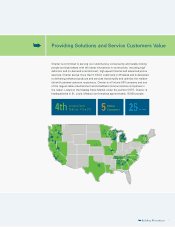
I see tremendous opportunity for Charter. Our robust network passes 12 million homes
along with businesses that spend an estimated $8.5 billion on communications services.
We are making investments to drive growth in both the near and longer terms. We see
a substantial opportunity to earn new customer relationships as well as expand our
communications and entertainment solutions in our existing customers’ homes. The
commercial side of the business also provides significant growth opportunity.
We are gaining momentum as we move into 2012. We are focused on ensuring that we
constantly improve the fundamentals of our business; that we take care of our customers’
needs; that we offer products and services that are better than the alternatives; and that
we’re a company that customers want to do business with. We continue to emphasize
four strategic priorities:
■ Fundamentally improving the customer experience. Our goal is to deliver an
unmatched customer experience through a multi-year, company-wide initiative.
We still have a lot of work to do, but the transformation is taking hold, and early
customer feedback is positive.
3Building Momentum
➥
Tom Rutledge, President and Chief Executive Officer
Charter has a robust network, capable of
delivering a quality customer experience today,
with the flexibility to add the communications
and entertainment services of tomorrow.
201120102009
$7,224
$7,034
$6,711
Revenue1
(in millions)
201120102009
$2,680
$2,595
$2,483
Adjusted EBITDA1, 2
(in millions)
1
Pro forma results are described on
page F-53 of this Annual Report.
2
See Use of Non-GAAP Financial
Measures on page F-53 of this
Annual Report.