Charter 2011 Annual Report Download - page 47
Download and view the complete annual report
Please find page 47 of the 2011 Charter annual report below. You can navigate through the pages in the report by either clicking on the pages listed below, or by using the keyword search tool below to find specific information within the annual report.-
 1
1 -
2
-
3
-
4
-
5
-
6
-
7
-
8
-
9
-
10
-
11
-
12
-
13
-
14
-
15
-
16
-
17
-
18
-
19
-
20
-
21
-
22
-
23
-
24
-
25
-
26
-
27
-
28
-
29
-
30
-
31
-
32
-
33
-
34
-
35
-
36
-
 37
37 -
 38
38 -
 39
39 -
 40
40 -
 41
41 -
 42
42 -
 43
43 -
 44
44 -
 45
45 -
 46
46 -
 47
47 -
 48
48 -
 49
49 -
 50
50 -
 51
51 -
 52
52 -
 53
53 -
 54
54 -
 55
55 -
 56
56 -
 57
57 -
58
-
59
-
60
-
61
-
62
-
63
-
64
-
65
-
66
-
67
-
68
-
69
-
70
-
71
-
72
-
73
-
74
-
75
-
76
-
77
-
78
-
79
-
80
-
81
-
82
-
83
-
84
-
85
-
86
-
87
-
88
-
89
-
90
-
91
-
92
-
93
-
94
-
95
-
96
-
97
-
98
-
99
-
100
-
101
-
102
-
103
-
104
-
105
-
106
-
107
-
108
-
109
-
110
-
111
-
112
-
113
-
114
-
115
-
116
-
117
-
118
-
119
-
120
-
121
-
122
-
123
-
124
-
125
-
126
-
127
-
128
-
129
-
130
-
131
-
132
-
133
-
134
-
135
-
136
-
137
-
138
-
139
-
140
-
141
 |
 |
35
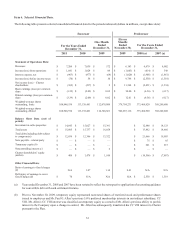
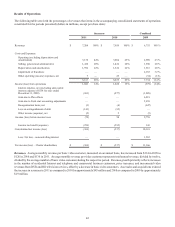
conditions in the United States, including the housing market and relatively high unemployment levels, have adversely affected
consumer demand for our services, particularly basic video. These conditions combined with our disciplined customer acquisition
strategy contributed to video revenues declining 2% for the year ended December 31, 2011 compared to the corresponding period
in 2010 and remaining flat for the year ended December 31, 2010 compared to the corresponding period in 2009. Total revenue
growth was 2% for the year ended December 31, 2011 compared to the corresponding period in 2010 and 5% for the year ended
December 31, 2010 compared to the corresponding period in 2009 as we continued to grow our commercial, Internet and telephone
businesses. However, we believe competition from wireless and economic factors have contributed to an increase in the number
of homes that replace their traditional telephone service with wireless service thereby impacting the growth of our telephone
business. Our business plans include goals for increasing the number of customers which contribute to recurring revenue and the
opportunity to sell additional services to existing customers. In 2012, we may continue to experience challenges in increasing, or
we may continue to lose, customers. If these conditions do not improve, we believe the growth of our business and results of
operations will be further adversely affected which may contribute to future impairments of our franchises and goodwill.
Approximately 85% of our revenues for both of the years ended December 31, 2011 and 2010 are attributable to monthly subscription
fees charged to customers for our video, Internet, telephone, and commercial services provided by our cable systems. Generally,
these customer subscriptions may be discontinued by the customer at any time subject to a fee for early termination of a price
guarantee product. The remaining 15% of revenue for fiscal years 2011 and 2010 is derived primarily from advertising revenues,
franchise and other regulatory fee revenues (which are collected by us but then paid to local authorities), pay-per-view and
OnDemand programming, installation, processing fees or reconnection fees charged to customers to commence or reinstate service,
and commissions related to the sale of merchandise by home shopping services.
Our expenses primarily consist of operating costs, selling, general and administrative expenses, depreciation and amortization
expense, impairment of franchise intangibles and interest expense. Operating costs primarily include programming costs, the cost
of our workforce, cable service related expenses, advertising sales costs and franchise fees. Selling, general and administrative
expenses primarily include salaries and benefits, rent expense, billing costs, call center costs, internal network costs, bad debt
expense, and property taxes. We control our costs of operations by maintaining strict controls on expenditures. More specifically,
we are focused on managing our cost structure by improving workforce productivity, increasing the effectiveness of our purchasing
activities and maintaining discipline in customer acquisition.
For the years ended December 31, 2011, 2010 and 2009, adjusted earnings (loss) before interest expense, income taxes, depreciation
and amortization (“Adjusted EBITDA”) was $2.7 billion, $2.6 billion and $2.5 billion, respectively. See “—Use of Adjusted
EBITDA and Free Cash Flow” for further information on Adjusted EBITDA and free cash flow. Adjusted EBITDA increased as
a result of continued growth in high margin Internet, commercial and telephone customers, continued disciplined customer
acquisition and improving customer service levels. For each of the years ended December 31, 2011 and 2010, our income from
operations was $1.0 billion, and for the year ended 2009, our loss from operations was $979 million. Our income from operations
for the years ended December 31, 2011 and 2010 compared to the loss from operations for the year ended December 31, 2009 is
primarily due to impairment of franchises incurred during 2009 that did not recur in 2011 and 2010.
We have a history of net losses. Our net losses are principally attributable to insufficient revenue to cover the combination of
operating expenses, interest expenses that we incur because of our debt, depreciation expenses resulting from the capital investments
we have made and continue to make in our cable properties, amortization expenses resulting from the application of fresh start
accounting in 2010 and non-cash taxes resulting from increases in our deferred tax liabilities. The Plan resulted in the reduction
of the principal amount of our debt by approximately $8 billion, reducing our interest expense by approximately $830 million
annually.